

Results — trait emergence over time#
Once a run is finished, the colony overlays under
deliverables/overlays/<dataset>/ capture how each plate looked at every timepoint.
The Timeline tab of the results viewer lays those overlays out as a matrix —
one row per grouping (e.g. plate number), one column per timepoint — so you can
watch a trait emerge across a single plate’s time-course and compare plates side
by side without leaving the page.
It reuses the same focus-and-navigate engine as the Browse
Timeline, but draws its axes from the run’s
post-applied measurement mirror (OutputRoot.master_df, which already carries
the joined Metadata_* columns) and renders overlay thumbnails instead of raw
source images. Pop-outs reuse the viewer’s existing /tiles deep-zoom route, so
zoom and pan are GPU-smooth and need no extra wiring.
Step 1 - Open the Timeline tab and choose the axes#
Open a finished run in the results viewer (see View Results) and switch to the Timeline tab — the 6th tab in the strip. Two dropdowns drive the matrix:
Y (group) — the row axis. It offers every grouping column with no cardinality cap, so a high-cardinality grouping like
Metadata_PlateNum(one row per plate) is selectable.X (time) — the time axis. It offers any column whose name looks like a time field or whose dtype is numeric/temporal, with no cap. Prefer a monotonic column such as
Metadata_ImageNumber; a time-of-day column mis-orders across days.
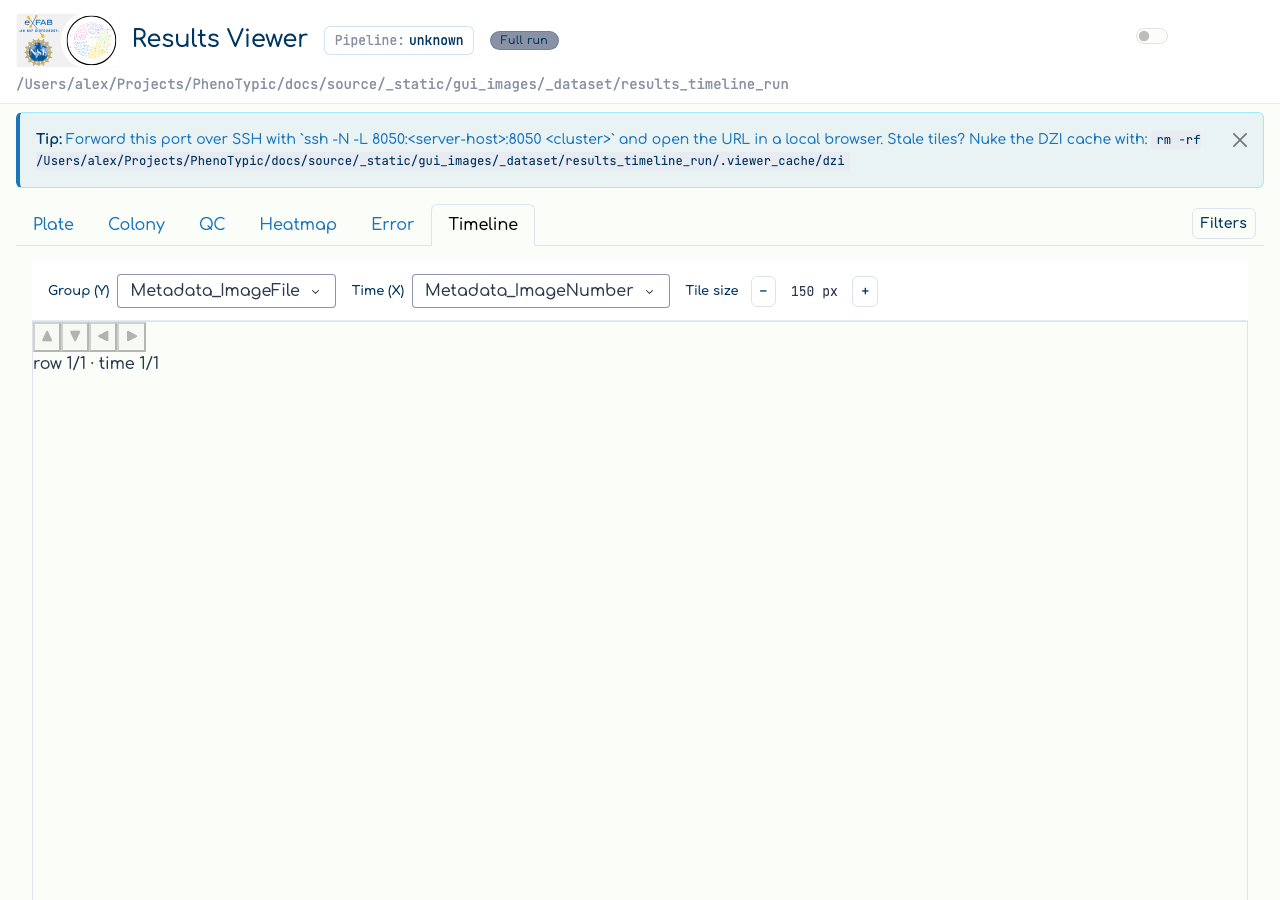
If the run has no eligible time column, the tab shows a guided empty state
instead of a matrix, nudging you to re-run with a --metadata <csv> that carries
a time field.
Note
The Timeline honors the active filter offcanvas — it renders the same
master_df slice as the Plate and Colony tabs, so narrowing the filter narrows
the matrix.
Step 2 - Navigate the matrix#
The matrix is not scrollable. A centered, no-scroll window renders around one focused cell (highlighted), and only the focused neighborhood plus a margin ring of just-off-screen cells mount their thumbnails — everything further out is offloaded, so the DOM stays light no matter how large the matrix is.
To move the focus:
Arrow keys — click the matrix viewport, then press ←/→ to walk one plate’s time-course and ↑/↓ to compare across plates. Focus clamps at the matrix edges (no wrap), and arrow keys are ignored while a dropdown holds focus.
Edge buttons (◀▶▲▼) — the four on-edge directional buttons move the focus the same way for pointer-only use.
Position readout — a
row N/M · time N/Mcaption reports where the focused cell sits in the matrix.
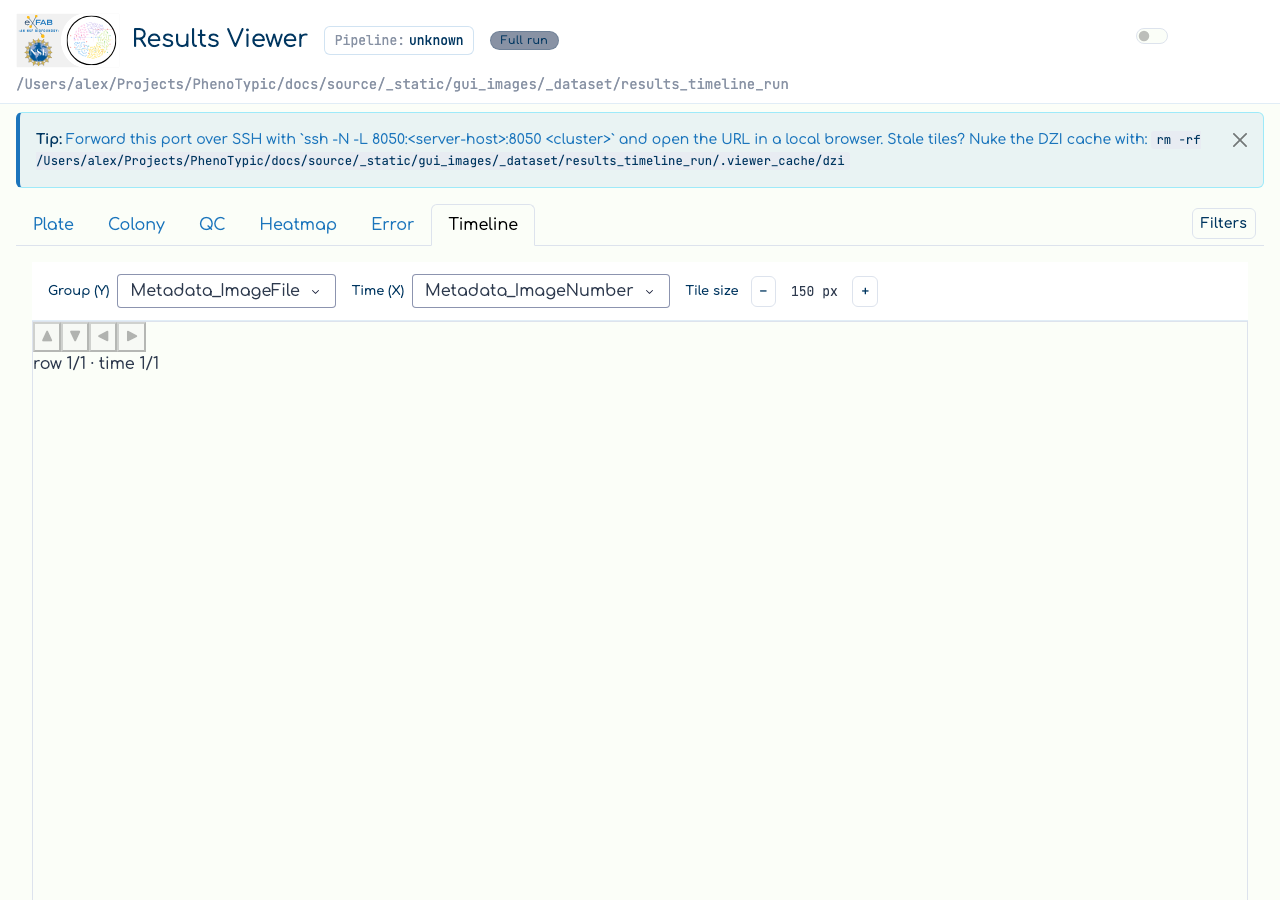
Each populated tile carries an N=k badge for the number of images that
resolved to that (row, time) cell, and a tile-size − / + stepper scales the
whole matrix between a configured min and max.
Step 3 - Deep-zoom a single plate#
To inspect one overlay at full resolution, open the deep-zoom pop-out:
Press Enter (or Space) on the focused cell, or
hover any visible tile and click the revealed ⤢ button.
Either path opens the same pop-out modal and mounts an OpenSeadragon viewer that reuses the viewer’s overlay DZI deep-zoom route. Close the modal to return to the matrix with your focus unchanged.
Note
Overlay thumbnails are cached on disk under the run’s
.viewer_cache/timeline_thumbs, a sibling of the DZI pyramid cache, so the
matrix is warm on tab re-entry regardless of the controller’s re-attach.
Where to next#
Browse — find the ideal starting time — the source-image Timeline the results Timeline mirrors.
Heatmap exploration — quantify a single measurement across the same plate × time grid.
Error analysis — rank the measurements that separate a curated error category from the good baseline.