

View Results#
The Results viewer pairs the master measurements parquet with each plate’s per-image OME-Zarr store. You pick an image from the dropdown, and the Plate stage reads that store’s chunks directly in your browser and paints the colony map with its objmap overlaid. There is no server-rendered tile pyramid and no tile cache to go stale — the deep-zoom levels are the ones the CLI already wrote into the store.
Hub viewer (empty state)#
Open the Viewer tab in the hub:
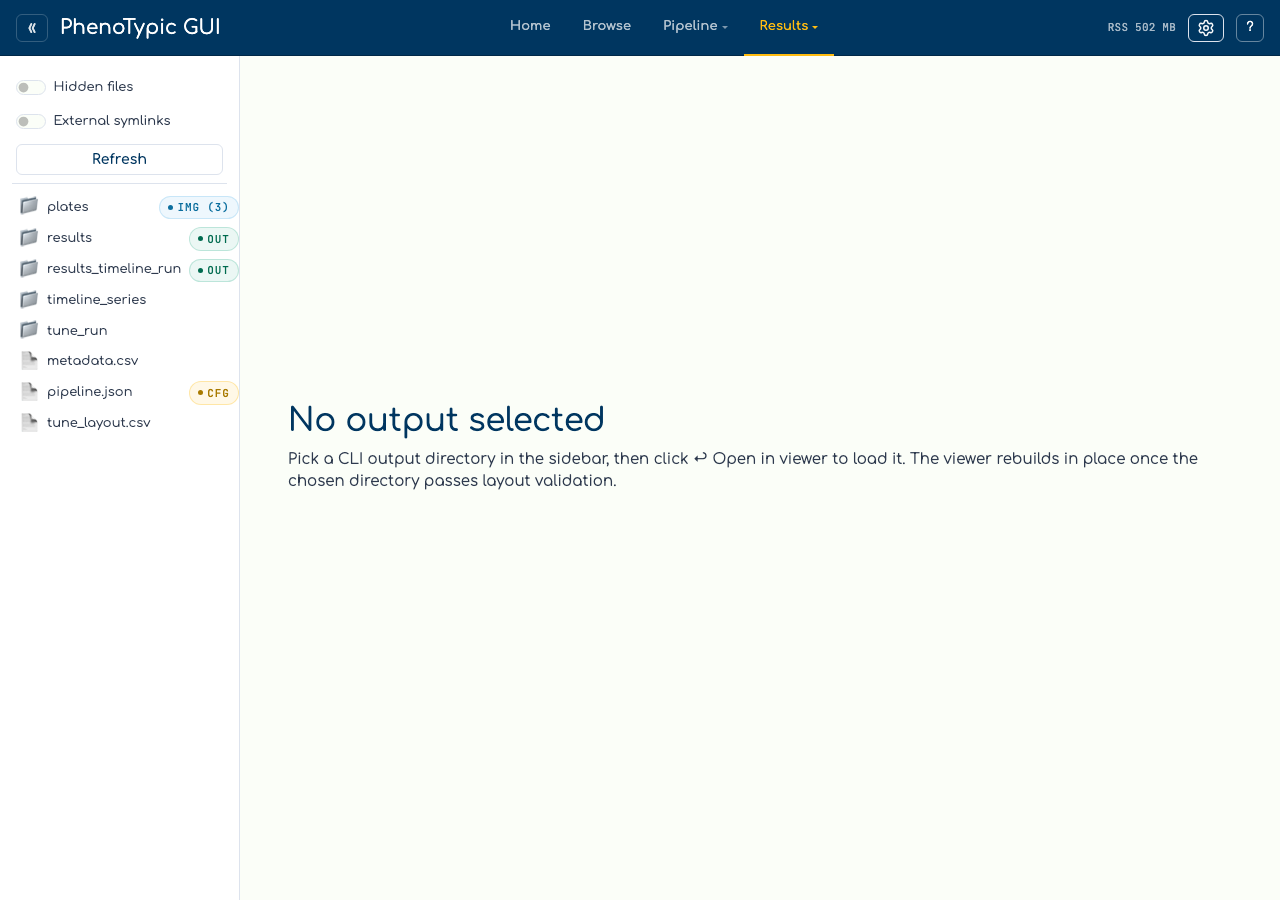
The hub viewer starts in empty state. Pick a CLI output directory in the
sidebar and use the hand-off banner to bind it. The shared binding panel reports
queued/discovery/publication progress and permits cancellation. Results and
Analysis receive one coherent, read-only snapshot, so a failed, cancelled, or
superseded bind keeps the previous output visible rather than mixing two runs.
If the output-consistency report finds contradictory or incomplete terminal
evidence, you may inspect it but mutation controls for QC, Error, curation,
Analysis, rebuild, and publication stay disabled. You can also open
deliverables/dashboard.html to monitor progress and inspect failures.
Local dashboards render progress directly; SLURM dashboards add Progress and
Download tabs. Use the Results Viewer or /analysis/ app for result
exploration.
The remaining screenshots show the viewer loaded with the output the Run Locally page produced.
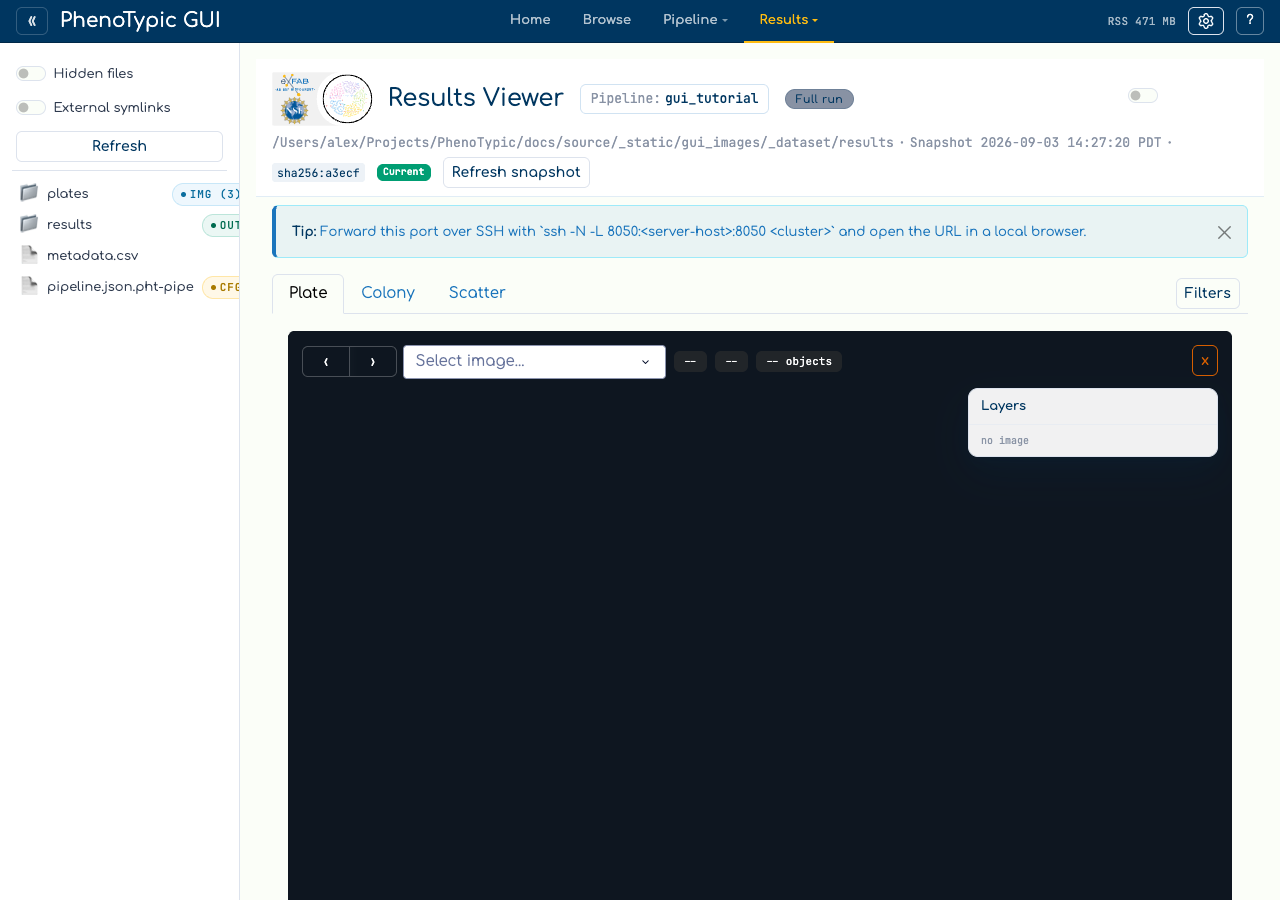
Loaded viewer#
Note
The screenshots below are the standalone results viewer (no top bar / sidebar) so the page header reads “Results Viewer” instead of “PhenoTypic GUI”. The body is identical to a bound hub snapshot.
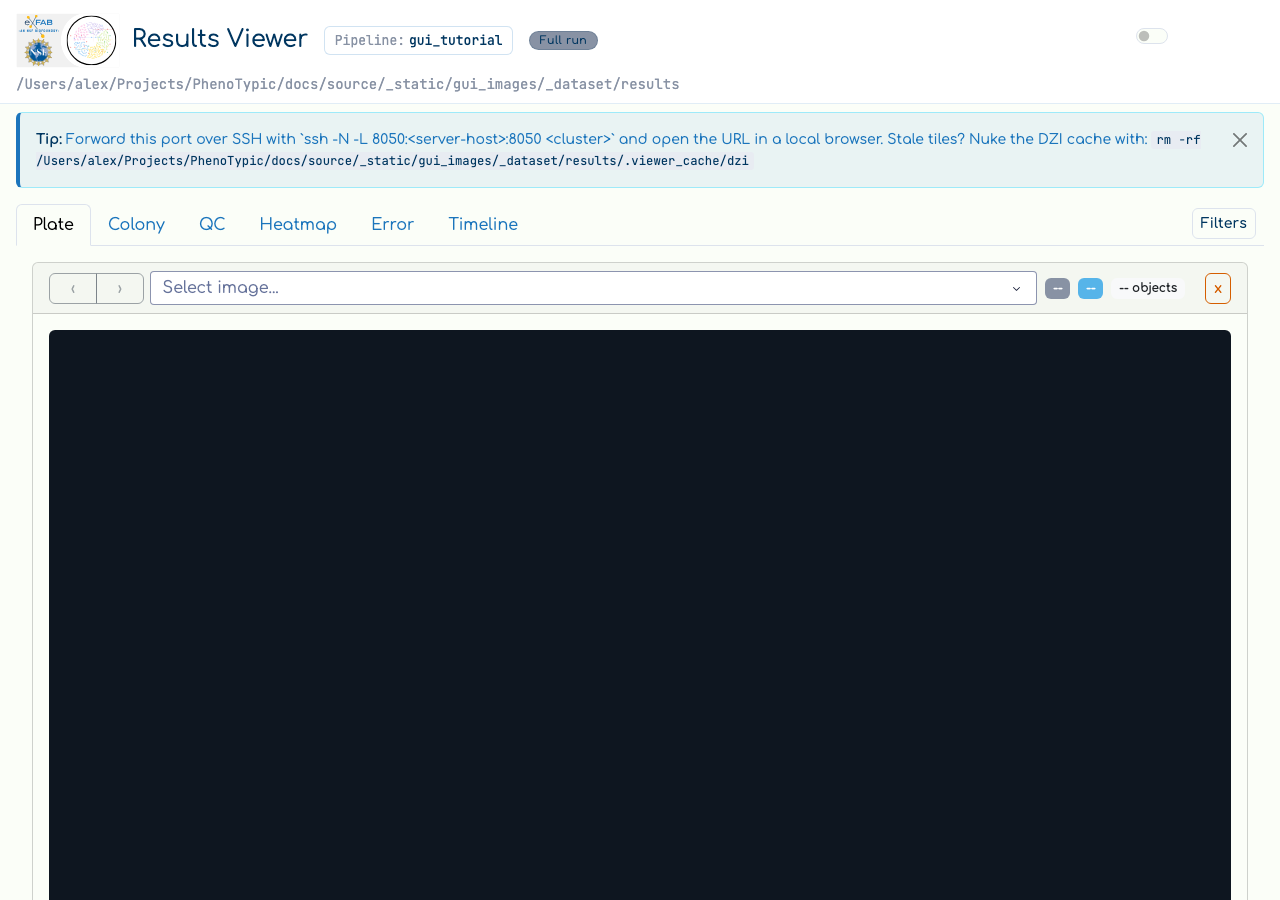
The Plate tab is one full-canvas image stage with every control floating over it:
Where |
Control |
|---|---|
Header (above the tabs) |
The output’s pipeline name (here |
Top-left, over the stage |
The |
Top-right, over the stage |
The Layers panel. It lists the series the store actually holds — |
Bottom-left, over the stage |
The current zoom. |
Bottom-right, over the stage |
The served-level readout, e.g. |
Colony tab |
Uniform object-centred regions aligned to the grid layout. One bounded camera controls every mounted tile at the same zoom and source-pixel offset. |
To render a plate, step to a filename with › or pick one from the
Select image… dropdown; both are populated from the master measurements.
The stage opens the store and begins painting, and the note under the
stage confirms the source (served directly from plate_001.ome.zarr — no tile cache).
Filters live in a right-docked slide-in rather than a left pane. The Filters button on the tab row opens it, and the badge on the button counts the active clauses:
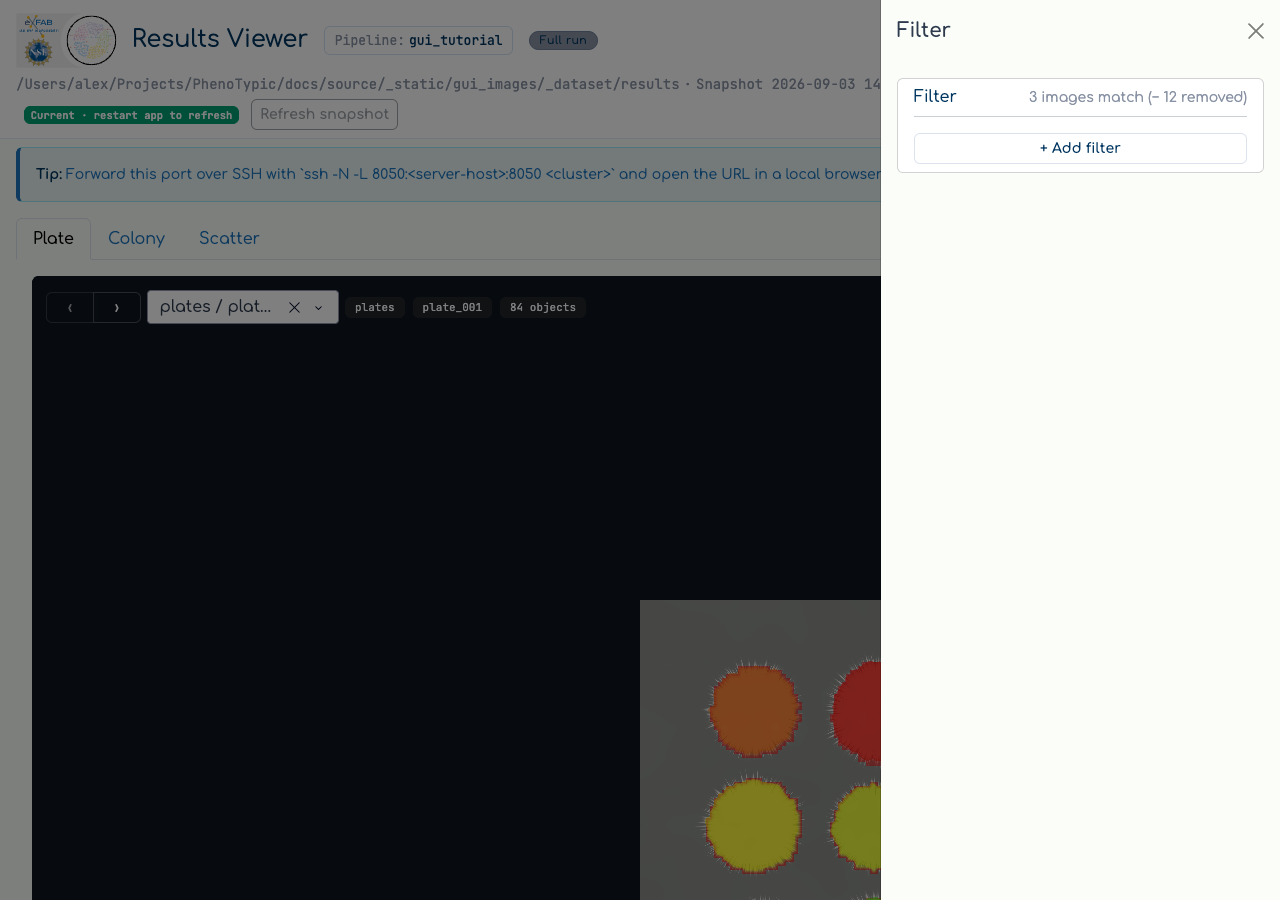
It is a query builder over deliverables/measurements.parquet (the
post-applied mirror; it falls back to
deliverables/master_measurements.parquet on legacy outputs). + Add filter adds a clause (column / operator / value) with the dropdown
populated from the parquet’s columns, and filtering narrows both Plate and
Colony.
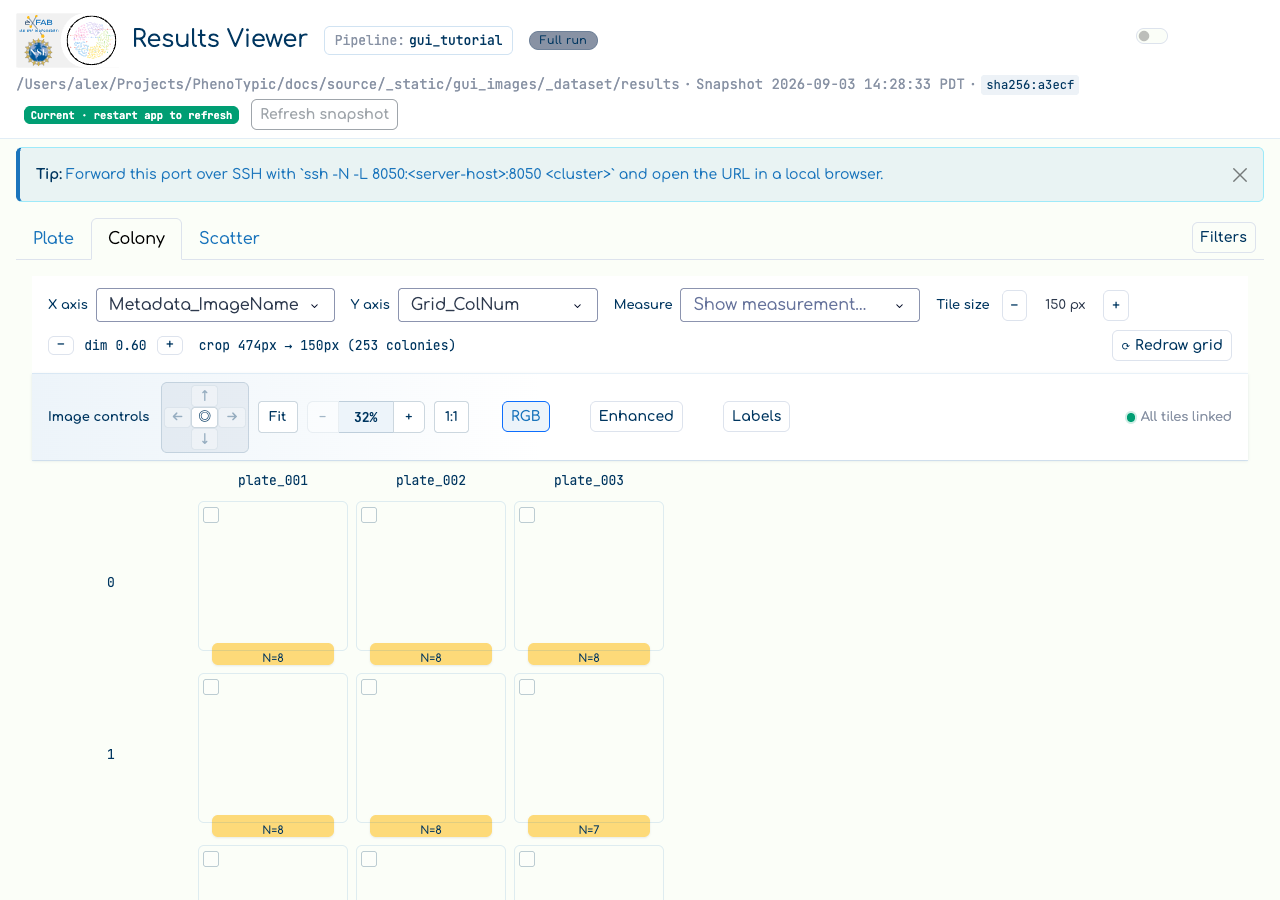
The Colony tab opens each object inside the same square source region,
whose side is sized from the largest padded object in the current grid. The
initial percentage fits that region inside the actual tile frame. The sticky
Image controls strip moves every tile together: use the D-pad to pan
within the fixed region, Center to clear the offset, Fit to restore
the comparison view, − / + to zoom, and 1:1 for one source pixel per
screen pixel. Arrow keys, 0, F, − / +, and 1 provide the same
actions while the toolbar or image grid has keyboard focus.
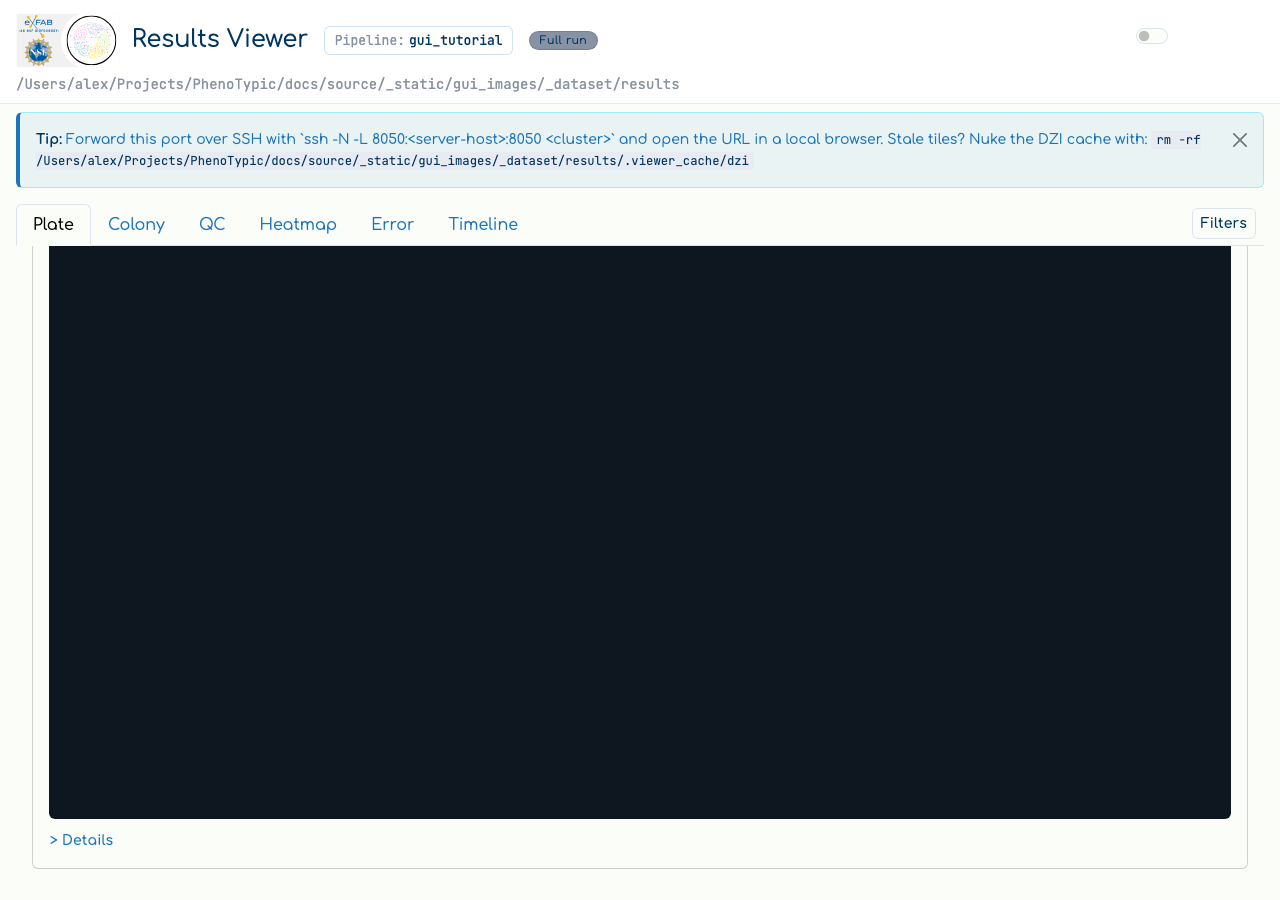
The > Details link under the stage opens the per-object table for the
displayed image — one row per colony, sortable and filterable in place,
with a Status column carrying each colony’s curation state.
Memory note#
The viewer loads the master measurements parquet into memory on first
access; pixels are not part of that — they are streamed from the store
to the browser a chunk at a time. If the parquet is large (tens of MB+),
expect the first navigation to take a moment. Subsequent navigation
between plates reuses the in-memory state. When the viewer is mounted
inside the hub, the hub chrome’s Release control (not visible in the
standalone screenshots above) drops the in-memory state; the next
access reloads from disk. Standalone viewers intentionally do not subscribe to
hub refresh events.
Process RSS may not return to the OS after release — the CPython allocator pools freed pages rather than returning them immediately. “Release” is honest about freeing the Python object graph; it is not a promise about RSS.
Where to next#
GUI hub guide — the full reference for every panel, store, and admonition in the hub.
SLURM Pipelines — chunk sizing, automatic continuation semantics, and recompile flags.
CLI Batch Processing — every CLI flag the Run console form exposes (and a few more).
CLI Execution Modes — what
full,measure,recompile, andprocesseach produce.