

QC curation loop#
The QC tab in the Results Viewer composes one Plotly card per
configured QualityCheck analyzer. Each card subscribes to the same
STORE_REMOVED_KEYS store that backs the “remove colony” toggle, so
every time you curate a flagged colony the card’s figure, summary
strip, and status badge re-render automatically — no manual refresh,
no full page reload.
The loop:
Configure one or more checks (e.g.
ExpectedVsDetectedCount,GridOccupancy,ReplicateAgreement).The card highlights every flagged group with its severity.
Mark all flagged colonies for removal (per-card button) or curate individuals from the Plate / Colony tabs.
The card re-renders; remaining severity drops; status badge transitions
fail → warn → pass.
Prerequisites#
A finished CLI run with
deliverables/master_measurements.parquet+ the post-applieddeliverables/measurements.parquetmirror under<output>/deliverables/measurements.parquet. See Run Locally to produce one.A
metadata.csvdescribing the expected plate layout if you plan to configureExpectedVsDetectedCountorGridOccupancy(theirgroupbycolumns must resolve against the master measurements schema). Both read the layout’s per-group row count as the expected colony/cell count;GridOccupancyadditionally counts distinct filled grid cells (Grid_RowMajorIdx), so it reports occupancy without double-counting doublets.
Walkthrough#
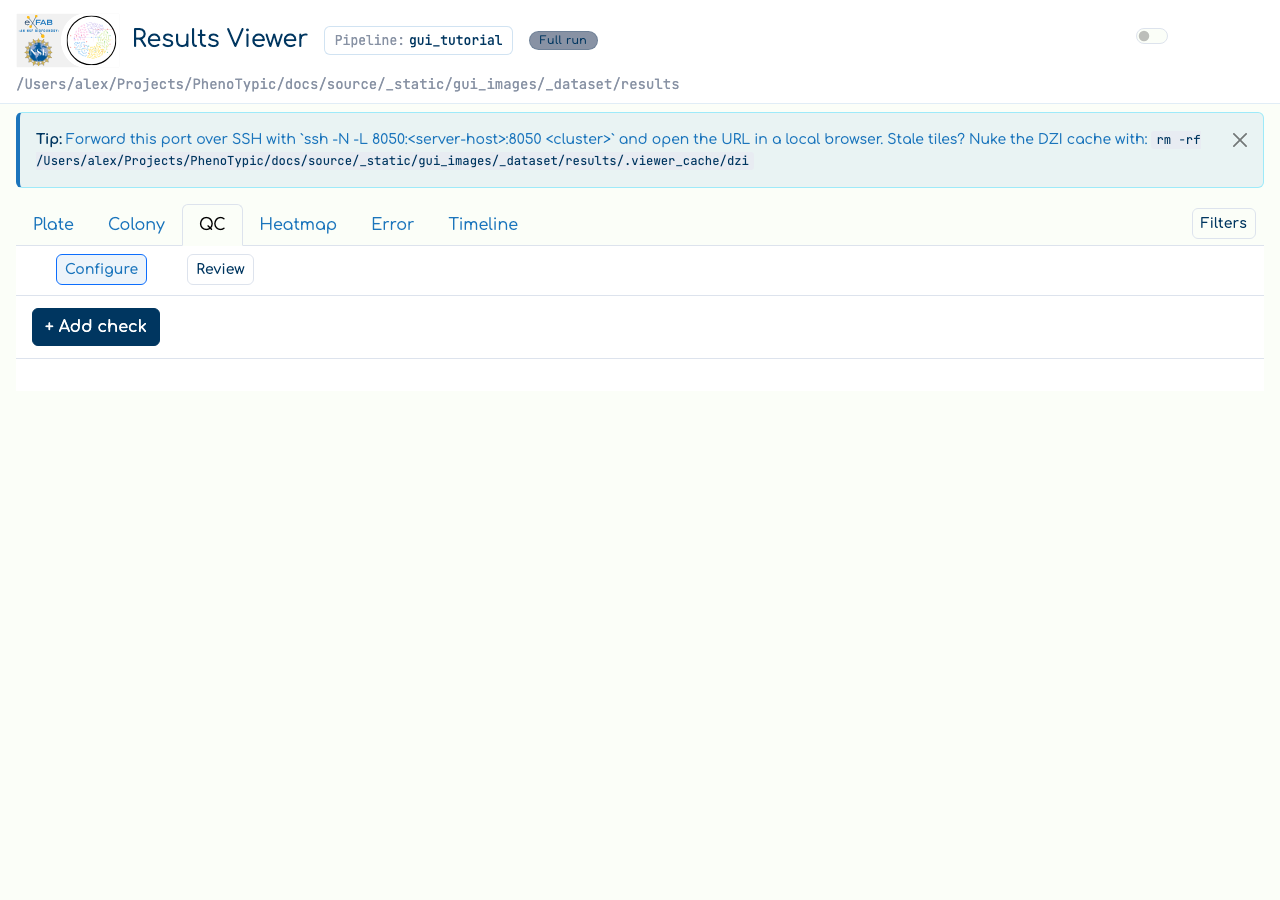
Open the Viewer tab in the hub and pick the QC sub-tab:
The empty state shows a placeholder explaining that no checks are configured yet. The top strip carries:
+ Add check— opens a modal listing every concreteQualityChecksubclass discovered byOperationRegistry.Export QC report— disabled until at least one check exists; emits<output>/qc.parquet+<output>/qc_summary.jsonkeyed byQC_Check_Class+QC_Check_Instance_Idso downstream notebooks can pivot per check.
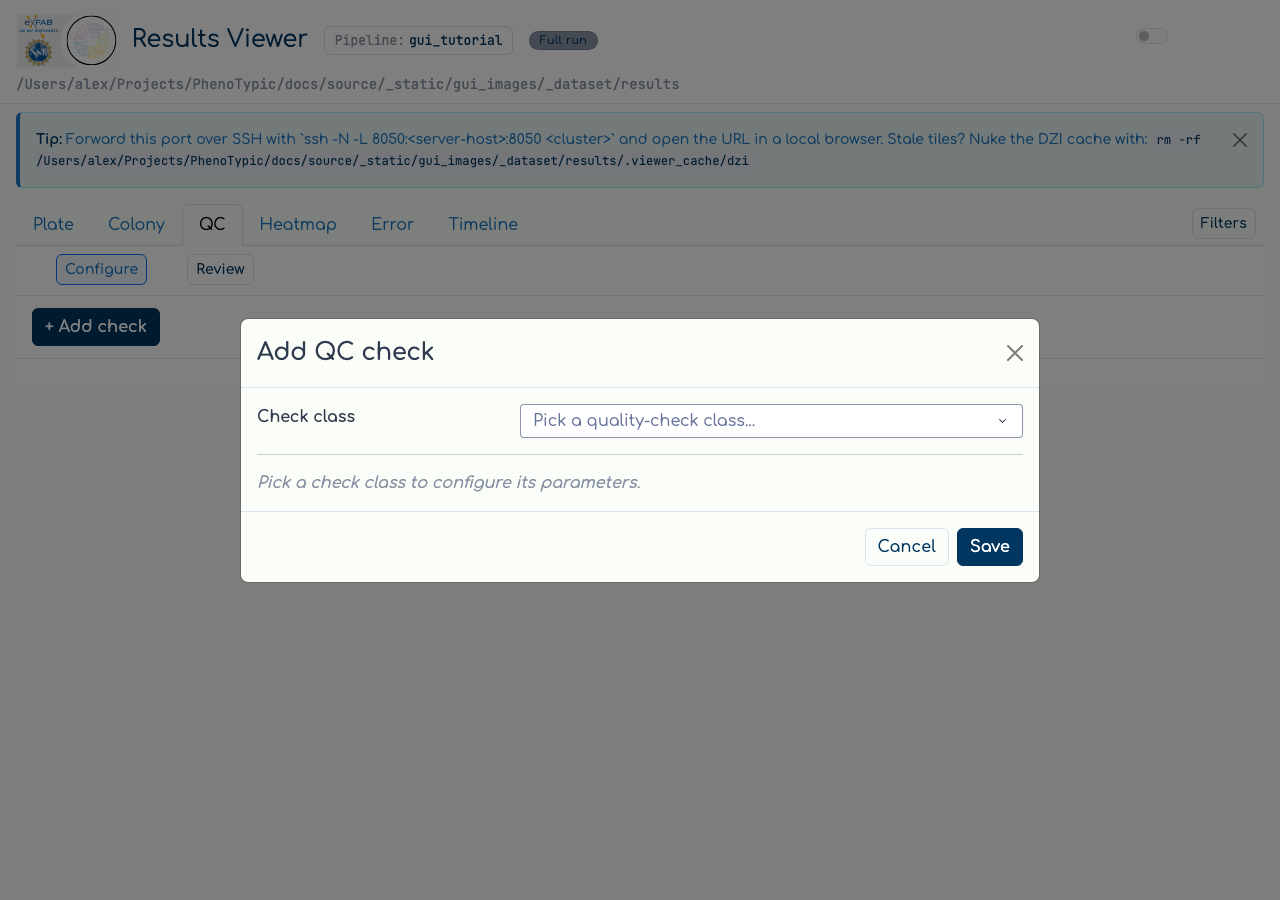
Click + Add check. The modal opens with a class dropdown plus an
inline param form that adapts to the chosen check’s constructor
signature:
Pick ExpectedVsDetectedCount, fill in the path to your plate-layout
metadata.csv, then click Save. A new card slides into the cards
container with:
a Plotly figure showing per-group Delta (expected − detected),
a summary strip reading
groups: N | flagged: K | max severity: X.YZ,a status badge coloured by the worst per-group status (green / yellow / red),
per-card buttons:
Edit,Duplicate,Toggle enabled,Delete, andMark all flagged for removal.
Switch to the Plate tab and remove a flagged colony (or hit the
per-card Mark all flagged for removal button to union every flagged
(ImageFile, Object_Label) into STORE_REMOVED_KEYS in one click).
Switching back to the QC tab shows the card re-rendered with the new
severity.
Common gotchas#
Metadata schema:
ExpectedVsDetectedCountreadsMetadata_ImageFile+Object_Labelfrom the supplied CSV. If the CSV has a different column name (e.g. legacyImageName), the check raises at instantiation time and the recipe records a load-warning instead of breaking the boot. The warning banner at the top of the QC tab lists the affectedinstance_idand the underlying error.QC recipe: every add / edit / delete writes the
qcarray in the pipeline config under<output>/deliverables/(pipeline.json.pht-pipeon current runs). A legacy<output>/.viewer_cache/qc_recipe.jsonsidecar is migrated once at viewer startup. Concurrent viewer sessions on the same output dir are still unsupported; if you reopen the viewer on a different machine, the recipe travels with the output directory.Severity legend: check-side
severity_warn/severity_failthresholds default to0.05/0.10. Tune them on the per-check edit modal to match your QC tolerance.
Where to next#
Heatmap exploration — pivot the same measurements into a plate-shaped heatmap and watch edge / contamination patterns light up.
View Results — the curation primitives the QC tab piggybacks on.
Analysis — once the QC chain is happy, configure filters + an endpoint model and emit
analysis.{csv,parquet}.