

Measurements#
METADATA_MATCH#
BBOX#
Column label |
Description |
Type |
|---|---|---|
|
The row coordinate of the center of the bounding box. |
|
|
The smallest row coordinate of the bounding box. |
|
|
The largest row coordinate of the bounding box. |
|
|
The column coordinate of the center of the bounding box. |
|
|
The smallest column coordinate of the bounding box. |
|
|
The largest column coordinate of the bounding box. |
|
|
The intensity-weighted center row coordinate of the object (skimage |
|
|
The intensity-weighted center column coordinate of the object (skimage |
|
|
Row coordinate of the per-object Euclidean-distance-transform maximum (deepest interior point of the object mask). Robust to thin filamentous extensions that pull intensity-weighted centroids off-body. |
|
|
Column coordinate of the per-object Euclidean-distance-transform maximum (deepest interior point of the object mask). Robust to thin filamentous extensions that pull intensity-weighted centroids off-body. |
ColorComposition#
Column label |
Description |
Type |
|---|---|---|
|
Percentage of pixels classified as black (Value < 20) |
|
|
Percentage of pixels classified as white (Saturation < 15, Value > 85) |
|
|
Percentage of pixels classified as gray (Saturation < 15, Value 20-85) |
|
|
Percentage of pixels classified as pink (Red/Magenta hue, Saturation 20-60, Value > 80) |
|
|
Percentage of pixels classified as brown (Red/Orange hue, Value 20-60) |
|
|
Percentage of pixels classified as red (Hue 0-15° or 345-360°) |
|
|
Percentage of pixels classified as orange (Hue 15-45°) |
|
|
Percentage of pixels classified as yellow (Hue 45-75°) |
|
|
Percentage of pixels classified as green (Hue 75-150°) |
|
|
Percentage of pixels classified as cyan (Hue 150-180°) |
|
|
Percentage of pixels classified as blue (Hue 180-250°) |
|
|
Percentage of pixels classified as purple/magenta (Hue 250-345°) |
ColorHSV#
Column label |
Description |
Type |
|---|---|---|
|
Hue of the cone-embedded geometric-median robust center (circular-correct) |
|
|
Saturation of the cone-embedded geometric-median robust center |
|
|
Value (brightness) of the cone-embedded geometric-median robust center |
|
|
Trace of the HSV cone-Cartesian covariance (single 3D HSV spread scalar); spread about the arithmetic mean of the cone coordinates (NOT about the reported RobustMean center) |
ColorLab#
Column label |
Description |
Type |
|---|---|---|
|
L* of the ΔE76 (Euclidean) geometric-median center color of the object |
|
|
a* of the ΔE76 (Euclidean) geometric-median center color of the object |
|
|
b* of the ΔE76 (Euclidean) geometric-median center color of the object |
|
|
L* of the ΔE2000 medoid center color (real pixel minimizing total ΔE2000) |
|
|
a* of the ΔE2000 medoid center color (real pixel minimizing total ΔE2000) |
|
|
b* of the ΔE2000 medoid center color (real pixel minimizing total ΔE2000) |
|
|
Median ΔE2000 of object pixels from the ΔE2000 medoid center (robust perceptual MAD) |
|
|
Mean ΔE2000 of object pixels from the ΔE2000 medoid center (color-uniformity standard) |
|
|
95th-percentile ΔE2000 of object pixels from the ΔE2000 medoid center (worst-case / sectoring flag) |
|
|
Trace of the 3x3 L*a*b* covariance (var L* + var a* + var b*); mean-squared ΔE76 spread about the arithmetic mean (NOT about the reported GeoMedian/Medoid center) |
|
|
sRGB hex string of the ΔE2000 medoid color; for plot visualization only (not a numeric measurement) |
Colorxy#
Column label |
Description |
Type |
|---|---|---|
|
The minimum chromaticity x coordinate of the object |
|
|
The lower quartile (Q1) chromaticity x coordinate of the object |
|
|
The mean chromaticity x coordinate of the object |
|
|
The median chromaticity x coordinate of the object |
|
|
The upper quartile (Q3) chromaticity x coordinate of the object |
|
|
The maximum chromaticity x coordinate of the object |
|
|
The standard deviation of the chromaticity x coordinate of the object |
|
|
The coefficient of variation of the chromaticity x coordinate of the object |
|
|
The minimum chromaticity y coordinate of the object |
|
|
The lower quartile (Q1) chromaticity y coordinate of the object |
|
|
The mean chromaticity y coordinate of the object |
|
|
The median chromaticity y coordinate of the object |
|
|
The upper quartile (Q3) chromaticity y coordinate of the object |
|
|
The maximum chromaticity y coordinate of the object |
|
|
The standard deviation of the chromaticity y coordinate of the object |
|
|
The coefficient of variation of the chromaticity y coordinate of the object |
ColorXYZ#
Column label |
Description |
Type |
|---|---|---|
|
The minimum X value of the object in CIE XYZ color space |
|
|
The lower quartile (Q1) X value of the object in CIE XYZ color space |
|
|
The mean X value of the object in CIE XYZ color space |
|
|
The median X value of the object in CIE XYZ color space |
|
|
The upper quartile (Q3) X value of the object in CIE XYZ color space |
|
|
The maximum X value of the object in CIE XYZ color space |
|
|
The standard deviation of the X value of the object in CIE XYZ color space |
|
|
The coefficient of variation of the X value of the object in CIE XYZ color space |
|
|
The minimum Y value of the object in CIE XYZ color space |
|
|
The lower quartile (Q1) Y value of the object in CIE XYZ color space |
|
|
The mean Y value of the object in CIE XYZ color space |
|
|
The median Y value of the object in CIE XYZ color space |
|
|
The upper quartile (Q3) Y value of the object in CIE XYZ color space |
|
|
The maximum Y value of the object in CIE XYZ color space |
|
|
The standard deviation of the Y value of the object in CIE XYZ color space |
|
|
The coefficient of variation of the Y value of the object in CIE XYZ color space |
|
|
The minimum Z value of the object in CIE XYZ color space |
|
|
The lower quartile (Q1) Z value of the object in CIE XYZ color space |
|
|
The mean Z value of the object in CIE XYZ color space |
|
|
The median Z value of the object in CIE XYZ color space |
|
|
The upper quartile (Q3) Z value of the object in CIE XYZ color space |
|
|
The maximum Z value of the object in CIE XYZ color space |
|
|
The standard deviation of the Z value of the object in CIE XYZ color space |
|
|
The coefficient of variation of the Z value of the object in CIE XYZ color space |
CURATION#
LINEAR_CAP_AND_LAG_MODEL#
Column label |
Description |
Type |
|---|---|---|
|
The post-lag phase growth rate. |
|
|
The initial size |
|
|
The duration of the lag phase |
|
|
lag phase transition sharpness |
|
|
Carrying capacity used by the model. Either the user-provided scalar or the per-group observed maximum. |
|
|
Saturation transition sharpness. Fitted per-group when a saturation shoulder is detected and |
|
|
Fit variant selected per-group: ‘fixed_beta’ (beta held at the user-provided or module-default value) or ‘fitted_beta’ (beta fitted as a 5th free parameter when a saturation shoulder is detected). |
EDGE_CORRECTION#
ErrorCategory#
Column label |
Description |
Type |
|---|---|---|
|
One colony split into multiple detections. |
|
|
A single colony under-detected — its mask captured too small or only partially covering the colony. |
|
|
Multiple touching colonies detected as one object. |
|
|
Not a colony — agar texture, reflection, or vignette. |
|
|
Dust, scratch, bubble, or other plate artifact. |
|
|
Removed without a specified reason (the catch-all bucket). |
GRID#
Column label |
Description |
Type |
|---|---|---|
|
The row idx of the object |
|
|
The start of the row interval of the object |
|
|
The end of the row interval of the object |
|
|
The column idx of the object |
|
|
The start of the column interval of the object |
|
|
The end of the column interval of the object |
|
|
The row-major index of the object. Row major is the standard in most programming and data science array libraries. Used for indexing into 2D arrays. |
|
|
The col-major index of the object in an array. Lab automation logic uses column-major (column-wise) indexing for well plate operations because 96-well plates are physically arranged with 8 rows (labeled A-H) and 12 columns (numbered 1-12), and this layout maps directly to how multichannel pipettes operate. |
GRID_LINREG_STATS#
Column label |
Description |
Type |
|---|---|---|
|
Slope of row-wise linear regression fit across column positions. Measures systematic drift in row alignment. Values near 0 indicate horizontal rows; non-zero values suggest rotational misalignment or systematic row curvature across the plate. |
|
|
Intercept of row-wise linear regression fit. Represents the expected row coordinate when column position is 0. Combined with slope, defines the expected row trend line for quality assessment and position prediction. |
|
|
Slope of column-wise linear regression fit across row positions. Measures systematic drift in column alignment. Values near 0 indicate vertical columns; non-zero values suggest rotational misalignment or systematic column curvature across the plate. |
|
|
Intercept of column-wise linear regression fit. Represents the expected column coordinate when row position is 0. Combined with slope, defines the expected column trend line for quality assessment and position prediction. |
|
|
Predicted row coordinate from column-wise linear regression. Uses the column position and column regression parameters (ColM, ColB) to estimate where the row coordinate should be if the grid were perfectly aligned. Used for calculating residual errors and detecting misaligned colonies. |
|
|
Predicted column coordinate from row-wise linear regression. Uses the row position and row regression parameters (RowM, RowB) to estimate where the column coordinate should be if the grid were perfectly aligned. Used for calculating residual errors and detecting misaligned colonies. |
|
|
Euclidean distance between the actual colony centroid and the predicted position from linear regression. Quantifies how far each colony deviates from the expected grid pattern. High values indicate misdetections, off-grid growth, or local plate warping. Used by refinement operations to filter outliers and select the most plausible colony per grid cell. |
NEIGHBOR_DIST#
Column label |
Description |
Type |
|---|---|---|
|
The object label of the left neighbor colony |
|
|
The minimum pixel-to-pixel distance to the left neighbor colony, computed via a Euclidean distance transform of object pixel masks |
|
|
The object label of the right neighbor colony |
|
|
The minimum pixel-to-pixel distance to the right neighbor colony, computed via a Euclidean distance transform of object pixel masks |
|
|
The object label of the above neighbor colony |
|
|
The minimum pixel-to-pixel distance to the above neighbor colony, computed via a Euclidean distance transform of object pixel masks |
|
|
The object label of the under neighbor colony |
|
|
The minimum pixel-to-pixel distance to the under neighbor colony, computed via a Euclidean distance transform of object pixel masks |
GRID_SPREAD#
Column label |
Description |
Type |
|---|---|---|
|
Sum of squared pairwise Euclidean distances between all unique colony pairs within a grid section. Quantifies spatial dispersion of colonies in a grid cell. Higher values indicate greater spread from the section center, suggesting over-segmentation, multi-detections, or colonies growing beyond expected boundaries. Used to identify problematic grid sections requiring refinement or quality review. |
INTENSITY#
Column label |
Description |
Type |
|---|---|---|
|
The sum of the object’s pixels |
|
|
The ratio of the object’s intensity to the max possible intensity of the object |
|
|
The ratio of the objects intensity to the max possible intensity of the object’s convex hull |
|
|
The minimum intensity of the object |
|
|
The maximum intensity of the object |
|
|
The mean intensity of the object |
|
|
The median intensity of the object |
|
|
The standard deviation of the object |
|
|
The coefficient of variation of the object |
|
|
The lower quartile intensity of the object |
|
|
The upper quartile intensity of the object |
|
|
The interquartile range of the object |
LINEAR_LAG_MODEL#
Column label |
Description |
Type |
Biology |
|---|---|---|---|
|
The post-lag phase growth rate. |
The post-lag phase growth rate using the target metric (usually radius) |
|
|
The initial value of the target metric |
The initial size |
|
|
The duration of the lag phase |
||
|
lag phase transition sharpness |
LOG_GROWTH_MODEL#
Column label |
Description |
Type |
|---|---|---|
|
The intrinsic growth rate |
|
|
The carrying capacity |
|
|
The initial number of the colony size metric being fitted |
|
|
The regularization factor applied to the max specific growth rate and initial population size |
|
|
The penalty factor applied to relative difference of the carrying capacity from the largest measurement |
|
|
The growth rate of the colony calculated as (K*r)/4 |
|
|
The upper bound of the carrying capacity for model fitting |
MODEL_METRICS#
Column label |
Description |
Type |
|---|---|---|
|
The mean absolute error |
|
|
The mean squared error |
|
|
The root mean squared error |
|
|
The coefficient of determination |
|
|
The number of samples used for model fitting |
|
|
The loss of model fitting |
|
|
The output of the optimizer status |
OBJECT#
Column label |
Description |
Type |
|---|---|---|
|
Integer label uniquely identifying each detected object (colony) within its source image. Acts as the per-image primary key shared by every measurement table, letting all per-colony measurements be joined together and traced back to a single colony on the agar plate. |
QUALITY_CHECK#
Column label |
Description |
Type |
|---|---|---|
|
True when the metric crosses fail_threshold in the bad direction; eligible for curation. |
|
|
Headline metric in the check’s own units; the bad direction is set by the check’s _HIGHER_IS_BAD flag. Drives Status. |
|
|
Categorical: pass | warn | fail. |
QUALITY_COUNT#
QUALITY_ICC#
QUALITY_MAD#
QUALITY_OCCUPANCY#
Column label |
Description |
Type |
|---|---|---|
|
Distinct grid cells holding at least one colony (doublets count once). |
|
|
Expected grid-cell count from the metadata frame (rows per group). |
|
|
Expected - Filled; empty/missing grid cells in the group. |
QUALITY_SE#
Column label |
Description |
Type |
|---|---|---|
|
Raw SE = stddev / sqrt(n) across replicates. |
|
|
Mean across replicates at this (group, time). |
|
|
Coefficient of variation, stddev / |mean|. |
|
|
Replicate count contributing to the SE. |
QUALITY_TUKEY#
QUALITY_ZMAX#
RADIAL_EXPANSION#
Column label |
Description |
Type |
|---|---|---|
|
Trimmed mean of branch path lengths, excluding detected runner. Represents the typical radial expansion distance of hyphae from the core boundary, robust to single-runner outliers. |
|
|
Arithmetic mean of all branch path lengths from core boundary to branch tips. Includes runner if present. Reflects overall average colony reach. |
|
|
Median branch path length. Robust to outliers and provides a typical expansion distance. |
|
|
Number of skeleton branches extending from the core boundary to peripheral tips. Higher counts indicate denser branching morphology. |
|
|
Length of the longest branch path in pixels. When a runner is detected, this equals RunnerLength. |
|
|
Path length of the detected runner branch (the single longest outlier). NaN if no runner detected. |
|
|
Boolean flag (0 or 1) indicating whether an outlier runner branch was detected for this colony. |
|
|
Radius of the dense colony core as determined by PELT changepoint detection on the radial density profile. Pixels within this radius of the intensity-weighted centroid are excluded from skeleton analysis. |
SHAPE#
Column label |
Description |
Type |
Biology |
Image |
|---|---|---|---|---|
|
Total number of pixels occupied by the microbial colony. Represents colony biomass and growth extent on agar plates. Larger areas typically indicate more robust growth or longer incubation times. |
Projected 2D footprint of the colony in pixels — a common proxy for colony size and overall growth in arrayed plate assays. With matched imaging and incubation, larger area generally reflects greater proliferation or spreading; it captures only the 2D footprint, not colony height or cell density. |
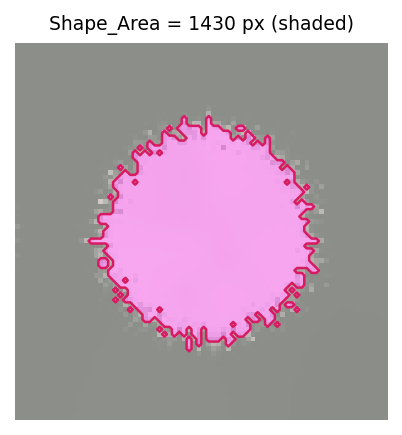
|
|
|
Total length of the colony’s outer boundary in pixels. Measures colony edge complexity and surface irregularity. Smooth, circular colonies have shorter perimeters relative to their area compared to irregular or filamentous colonies. |
|||
|
Calculated as \(\frac{4\pi*\text{Area}}{\text{Perimeter}^2}\). Measures how closely a colony approximates a perfect circle (value = 1). Values < 1 indicate irregular colony morphology, which may result from genetic mutations, environmental stress, or mixed microbial populations on agar plates. |
|||
|
Area of the smallest convex polygon that completely contains the colony. Represents the colony’s “filled-in” appearance if all indentations and holes were removed. Useful for detecting colony spreading patterns or invasive growth characteristics. |
|||
|
Median distance from colony center to edge across all directions. Provides a robust measure of typical colony size that is less sensitive to outliers than mean width. Particularly useful for colonies with uneven growth or sectoring. |
|||
|
Average distance from colony center to edge across all directions. Represents overall colony expansion rate. In arrayed growth assays, this correlates with microbial fitness and growth kinetics under controlled conditions. |
|||
|
Maximum distance from colony center to edge across all directions. Represents the furthest extent of colony growth from its center. In arrayed microbial assays, this measurement helps identify asymmetric growth patterns or colonies extending toward neighboring positions. |
|||
|
Minimum caliper diameter - the shortest distance between two parallel tangent lines touching opposite sides of the colony. Represents the narrowest dimension of the colony regardless of orientation. Useful for detecting elongated or irregular colony morphologies and measuring colony width. |
|||
|
Maximum caliper diameter - the longest distance between two parallel tangent lines touching opposite sides of the colony. Represents the maximum dimension of the colony regardless of orientation. Often exceeds major axis length for irregular shapes and helps quantify maximum colony extent. |
|||
|
Measure of colony elongation, ranging from 0 (perfect circle) to 1 (highly elongated). Values near 0 indicate compact, radially symmetric growth typical of healthy bacterial colonies, while higher values may suggest directional growth, motility, or environmental gradients on the agar surface. |
|||
|
Ratio of actual colony area to its convex hull area (Area/ConvexArea). Values near 1 indicate compact, solid colonies with minimal indentations. Lower values (< 0.9) may indicate invasive growth, colony spreading, or the presence of clearing zones around colonies. |
|||
|
Ratio of colony area to its bounding box area (ObjectArea/BboxArea). Measures how efficiently the colony fills its allocated space. Compact colonies have higher extent values, while spread-out or irregular colonies have lower values. |
|||
|
Area of the smallest rectangle that completely contains the colony. Represents the total spatial shape of the colony including any empty space. In high-throughput assays, this helps assess colony positioning and potential interference with neighboring colonies. |
|||
|
Length of the longest axis of the ellipse that best fits the colony shape. Represents the maximum colony dimension. In arrayed microbial growth, this measurement helps identify colonies that have grown beyond their intended grid positions. |
|||
|
Length of the shortest axis of the ellipse that best fits the colony shape. Represents the minimum colony dimension. Together with major axis length, this helps characterize colony aspect ratio and growth anisotropy. |
|||
|
Calculated as \(\frac{\text{Perimeter}^2}{4\pi*\text{Area}}\). Inverse of circularity (ranges from 1 for perfect circles to higher values for irregular shapes). Measures colony shape complexity - compact, circular colonies have values near 1, while irregular or filamentous colonies have much higher values. |
|||
|
Angle (in radians) between the colony’s major axis and the horizontal axis. Measures colony alignment and growth directionality. Random orientations are typical for most bacterial colonies, while consistent orientations may indicate environmental gradients or mechanical stresses during plating. |
SIZE#
Column label |
Description |
Type |
|---|---|---|
|
Total number of pixels occupied by the microbial colony.Larger areas typically indicate more robust growth or longer incubation times. |
|
|
The sum of the object’s grayscale pixels. Calculated as \(\sum{\text{pixel values}} \times \text{area}\). |
ORIENTATION_ZONE_DIAGNOSTIC#
Column label |
Description |
Type |
|---|---|---|
|
Largest absolute cumulative literal skeleton-ring rotation from the CoreZone boundary through the configured SparseZone outer boundary. Reported in degrees, nonnegative with no fixed upper bound. This raw maximum is outlier-sensitive and should be compared with the primary sustained peak. |
|
|
Largest absolute cumulative literal skeleton-ring rotation from the CoreZone boundary to dense_end. Reported in degrees, nonnegative with no fixed upper bound. This raw maximum is outlier-sensitive and should be compared with the primary sustained peak. |
|
|
Largest absolute cumulative literal skeleton-ring rotation from dense_end through the configured SparseZone outer boundary. Reported in degrees, nonnegative with no fixed upper bound. This raw maximum is outlier-sensitive. Cumulative rotation is not rebased at dense_end, so this Sparse magnitude may include rotation accumulated while the profile was in Dense. |
|
|
90th percentile of absolute cumulative literal skeleton-ring rotation over supported rings from the CoreZone boundary through the configured SparseZone outer boundary. Reported in degrees, nonnegative with no fixed upper bound. This validation comparator ignores radial order. |
|
|
90th percentile of absolute cumulative literal skeleton-ring rotation over supported rings from the CoreZone boundary to dense_end. Reported in degrees, nonnegative with no fixed upper bound. This validation comparator ignores radial order. |
|
|
90th percentile of absolute cumulative literal skeleton-ring rotation over supported rings from dense_end through the configured SparseZone outer boundary. Reported in degrees, nonnegative with no fixed upper bound. This comparator ignores radial order. Cumulative rotation is not rebased at dense_end, so this Sparse magnitude may include rotation accumulated while the profile was in Dense. |
|
|
95th percentile of absolute cumulative literal skeleton-ring rotation over supported rings from the CoreZone boundary through the configured SparseZone outer boundary. Reported in degrees, nonnegative with no fixed upper bound. With few supported rings it remains close to the raw maximum and is not the primary robust metric. |
|
|
95th percentile of absolute cumulative literal skeleton-ring rotation over supported rings from the CoreZone boundary to dense_end. Reported in degrees, nonnegative with no fixed upper bound. With few supported rings it remains close to the raw maximum. |
|
|
95th percentile of absolute cumulative literal skeleton-ring rotation over supported rings from dense_end through the configured SparseZone outer boundary. Reported in degrees, nonnegative with no fixed upper bound. Cumulative rotation is not rebased at dense_end, so this Sparse magnitude may include rotation accumulated while the profile was in Dense. |
|
|
Median absolute cumulative literal skeleton-ring rotation over supported rings from the CoreZone boundary through the configured SparseZone outer outer boundary. Reported in degrees, nonnegative with no fixed upper bound. This validation comparator describes typical magnitude but ignores radial order and localized outer turns. |
|
|
Median absolute cumulative literal skeleton-ring rotation over supported rings from the CoreZone boundary to dense_end. Reported in degrees, nonnegative with no fixed upper bound. This validation comparator describes typical magnitude but ignores radial order. |
|
|
Median absolute cumulative literal skeleton-ring rotation over supported rings from dense_end through the configured SparseZone outer boundary. Reported in degrees, nonnegative with no fixed upper bound. Cumulative rotation is not rebased at dense_end, so this Sparse magnitude may include rotation accumulated while the profile was in Dense. |
|
|
Trapezoidal area under absolute cumulative rotation within supported runs from the CoreZone boundary through the configured SparseZone outer outer boundary, divided by their total supported radial span. Reported in degrees, nonnegative with no fixed upper bound. It describes radially persistent rotation but can remain high after one early step. |
|
|
Trapezoidal area under absolute cumulative rotation within supported runs from the CoreZone boundary to dense_end, divided by their total supported radial span. Reported in degrees, nonnegative with no fixed upper bound. It describes radially persistent rotation but can remain high after one early step. |
|
|
Trapezoidal area under absolute cumulative rotation within supported runs from dense_end through the configured SparseZone outer boundary, divided by their total supported radial span. Reported in degrees, nonnegative with no fixed upper bound. Cumulative rotation is not rebased at dense_end, so this Sparse magnitude may include rotation accumulated while the profile was in Dense. |
|
|
Sum of absolute adjacent cumulative-rotation changes within supported runs from the CoreZone boundary through the configured SparseZone outer outer boundary, without bridging gaps. Reported in degrees, nonnegative with no fixed upper bound. It is sensitive to oscillation, profile length, and noise and is diagnostic only. |
|
|
Sum of absolute adjacent cumulative-rotation changes within supported runs from the CoreZone boundary to dense_end, without bridging gaps. Reported in degrees, nonnegative with no fixed upper bound. It is sensitive to oscillation, profile length, and noise and is diagnostic only. |
|
|
Sum of absolute adjacent cumulative-rotation changes within supported runs from dense_end through the configured SparseZone outer boundary, without bridging gaps. Reported in degrees, nonnegative with no fixed upper bound. It is sensitive to oscillation, profile length, and noise and is diagnostic only. |
|
|
Outer-half robust rotation rate minus inner-half robust rotation rate, divided by the separation of their median radii, along the longest supported run from the CoreZone boundary through the full detected outer boundary. Reported in signed degrees per pixel squared. This is a spatial rate gradient, not temporal acceleration, and is NaN unless the run meets both the configured minimum and eight rings. |
|
|
Outer-half robust rotation rate minus inner-half robust rotation rate, divided by the separation of their median radii, along the longest supported run from the CoreZone boundary to dense_end. Reported in signed degrees per pixel squared. This is a spatial rate gradient, not temporal acceleration, and is NaN unless the run meets both the configured minimum and eight rings. |
|
|
Outer-half robust rotation rate minus inner-half robust rotation rate, divided by the separation of their median radii, along the longest supported run from dense_end through the configured SparseZone outer boundary. Reported in signed degrees per pixel squared. This is a spatial rate gradient, not temporal acceleration, and is NaN for runs shorter than the larger of eight rings and the configured minimum. |
|
|
Fraction of candidate literal sampling rings from the CoreZone boundary through the configured SparseZone outer boundary with a finite cumulative-rotation state. Dimensionless in [0, 1]. This is a density-sensitive quality diagnostic, not an orientation phenotype. |
|
|
Fraction of candidate literal sampling rings from the CoreZone boundary to dense_end with a finite cumulative-rotation state. Dimensionless in [0, 1]. This is a density-sensitive quality diagnostic, not an orientation phenotype. |
|
|
Fraction of candidate literal sampling rings from dense_end through the configured SparseZone outer boundary with a finite cumulative-rotation state. Dimensionless in [0, 1]. This is a density-sensitive quality diagnostic, not an orientation phenotype. |
|
|
Radial span of the longest contiguous supported literal-crossing run divided by the full candidate span from the CoreZone boundary through the configured SparseZone outer boundary. Dimensionless in [0, 1]. This reports continuity of usable evidence, not orientation. |
|
|
Radial span of the longest contiguous supported literal-crossing run divided by the full candidate span from the CoreZone boundary to dense_end. Dimensionless in [0, 1]. This reports continuity of usable evidence, not orientation. |
|
|
Radial span of the longest contiguous supported literal-crossing run divided by the full candidate span from dense_end through the full detected outer boundary. Dimensionless in [0, 1]. This reports continuity of usable evidence, not orientation. |
|
|
Median doubled-angle resultant of crossing orientations among eligible literal rings from the CoreZone boundary through the full detected outer boundary. Dimensionless in [0, 1]; larger values mean stronger within-ring axial agreement. This is an orientation-reliability diagnostic, not a rotation phenotype. |
|
|
Median doubled-angle resultant of crossing orientations among eligible literal rings from the CoreZone boundary to dense_end. Dimensionless in [0, 1]; larger values mean stronger within-ring axial agreement. This is an orientation-reliability diagnostic, not a rotation phenotype. |
|
|
Median doubled-angle resultant of crossing orientations among eligible literal rings from dense_end through the configured SparseZone outer boundary. Dimensionless in [0, 1]; larger values mean stronger within-ring axial agreement. This is an orientation-reliability diagnostic, not a rotation phenotype. |
|
|
Coherence-weighted resultant length R of the doubled-angle orientation field over all tile pixels in the canonical Overall annulus (core_end .. sparse_end) region. Dimensionless in [0, 1]; 1 = perfectly aligned hyphae, 0 = isotropic. NaN when the summed coherence over the selector is ~0 or the zone has zero width. |
|
|
Coherence-weighted resultant length R of the doubled-angle orientation field over all tile pixels in the dense ring (core_end .. dense_end radii) region. Dimensionless in [0, 1]; 1 = perfectly aligned hyphae, 0 = isotropic. NaN when the summed coherence over the selector is ~0 or the zone has zero width. |
|
|
Coherence-weighted resultant length R of the doubled-angle orientation field over all tile pixels in the sparse ring (dense_end .. sparse_end radii) region. Dimensionless in [0, 1]; 1 = perfectly aligned hyphae, 0 = isotropic. NaN when the summed coherence over the selector is ~0 or the zone has zero width. |
|
|
Coherence-weighted resultant length R of the doubled-angle orientation field over detected-object pixels in the canonical Overall annulus (core_end .. sparse_end) region. Dimensionless in [0, 1]; 1 = perfectly aligned hyphae, 0 = isotropic. NaN when the summed coherence over the selector is ~0 or the zone has zero width. |
|
|
Coherence-weighted resultant length R of the doubled-angle orientation field over detected-object pixels in the dense ring (core_end .. dense_end radii) region. Dimensionless in [0, 1]; 1 = perfectly aligned hyphae, 0 = isotropic. NaN when the summed coherence over the selector is ~0 or the zone has zero width. |
|
|
Coherence-weighted resultant length R of the doubled-angle orientation field over detected-object pixels in the sparse ring (dense_end .. sparse_end radii) region. Dimensionless in [0, 1]; 1 = perfectly aligned hyphae, 0 = isotropic. NaN when the summed coherence over the selector is ~0 or the zone has zero width. |
|
|
Coherence-weighted mean orientation-gradient magnitude <|grad phi|> over all tile pixels in the canonical Overall annulus (core_end .. sparse_end), in degrees per pixel. Higher values indicate curving/fanning hyphae; ~0 indicates straight parallel growth. |
|
|
Coherence-weighted mean orientation-gradient magnitude <|grad phi|> over all tile pixels in the dense ring (core_end .. dense_end radii) region, in degrees per pixel. Higher values indicate curving/fanning hyphae; ~0 indicates straight parallel growth. |
|
|
Coherence-weighted mean orientation-gradient magnitude <|grad phi|> over all tile pixels in the sparse ring (dense_end .. sparse_end radii) region, in degrees per pixel. Higher values indicate curving/fanning hyphae; ~0 indicates straight parallel growth. |
|
|
Coherence-weighted mean orientation-gradient magnitude <|grad phi|> over detected-object pixels in the canonical Overall annulus (core_end .. sparse_end) region, in degrees per pixel. Higher values indicate curving/fanning hyphae; ~0 indicates straight parallel growth. |
|
|
Coherence-weighted mean orientation-gradient magnitude <|grad phi|> over detected-object pixels in the dense ring (core_end .. dense_end radii) region, in degrees per pixel. Higher values indicate curving/fanning hyphae; ~0 indicates straight parallel growth. |
|
|
Coherence-weighted mean orientation-gradient magnitude <|grad phi|> over detected-object pixels in the sparse ring (dense_end .. sparse_end radii) region, in degrees per pixel. Higher values indicate curving/fanning hyphae; ~0 indicates straight parallel growth. |
|
|
Mean structure-tensor coherence C over all tile pixels in the canonical Overall annulus (core_end .. sparse_end). Dimensionless in [0, 1]; a confidence/QC readout for how well orientation is defined there (low where texture is isotropic). |
|
|
Mean structure-tensor coherence C over all tile pixels in the dense ring (core_end .. dense_end radii) region. Dimensionless in [0, 1]; a confidence/QC readout for how well orientation is defined there (low where texture is isotropic). |
|
|
Mean structure-tensor coherence C over all tile pixels in the sparse ring (dense_end .. sparse_end radii) region. Dimensionless in [0, 1]; a confidence/QC readout for how well orientation is defined there (low where texture is isotropic). |
|
|
Mean structure-tensor coherence C over detected-object pixels in the canonical Overall annulus (core_end .. sparse_end). Dimensionless in [0, 1]; a confidence/QC readout for how well orientation is defined there (low where texture is isotropic). |
|
|
Mean structure-tensor coherence C over detected-object pixels in the dense ring (core_end .. dense_end radii) region. Dimensionless in [0, 1]; a confidence/QC readout for how well orientation is defined there (low where texture is isotropic). |
|
|
Mean structure-tensor coherence C over detected-object pixels in the sparse ring (dense_end .. sparse_end radii) region. Dimensionless in [0, 1]; a confidence/QC readout for how well orientation is defined there (low where texture is isotropic). |
|
|
Equal-angular-sector mean of the coherence-weighted absolute axial difference between the local fiber axis and the outward radial spoke at the same pixel, over detected-object pixels in the canonical Overall annulus (core_end .. sparse_end). Reported in degrees in [0, 90]; 0 = locally radial and 90 = locally tangential. Each occupied 10-degree angular sector contributes equally. For a fixed set of reliable sectors, multiplying branch evidence without changing within-sector tilt distributions leaves the result unchanged. A support-threshold crossing can add a newly reliable sector and change the estimate; mixed orientations within one sector remain pixel-weighted. |
|
|
Equal-angular-sector mean of the coherence-weighted absolute axial difference between the local fiber axis and the outward radial spoke at the same pixel, over detected-object pixels in the dense ring (core_end .. dense_end radii) region. Reported in degrees in [0, 90]; 0 = locally radial and 90 = locally tangential. Each occupied 10-degree angular sector contributes equally. For a fixed set of reliable sectors, multiplying branch evidence without changing within-sector tilt distributions leaves the result unchanged. A support-threshold crossing can add a newly reliable sector and change the estimate; mixed orientations within one sector remain pixel-weighted. |
|
|
Equal-angular-sector mean of the coherence-weighted absolute axial difference between the local fiber axis and the outward radial spoke at the same pixel, over detected-object pixels in the sparse ring (dense_end .. sparse_end radii) region. Reported in degrees in [0, 90]; 0 = locally radial and 90 = locally tangential. Each occupied 10-degree angular sector contributes equally. For a fixed set of reliable sectors, multiplying branch evidence without changing within-sector tilt distributions leaves the result unchanged. A support-threshold crossing can add a newly reliable sector and change the estimate; mixed orientations within one sector remain pixel-weighted. |
|
|
Equal-angular-sector mean radial derivative magnitude of the radial-relative fiber tilt, over detected-object pixels in the canonical Overall annulus (core_end .. sparse_end). Reported in degrees per pixel. 0 means the tilt stays constant while moving outward; larger values mean the local fiber field rotates relative to its radial spoke. The aggregation gives each occupied 10-degree angular sector equal weight. This is a field-level curvature measure, not parent-to-daughter branch tracking. |
|
|
Equal-angular-sector mean radial derivative magnitude of the radial-relative fiber tilt, over detected-object pixels in the dense ring (core_end .. dense_end radii) region. Reported in degrees per pixel. 0 means the tilt stays constant while moving outward; larger values mean the local fiber field rotates relative to its radial spoke. The aggregation gives each occupied 10-degree angular sector equal weight. This is a field-level curvature measure, not parent-to-daughter branch tracking. |
|
|
Equal-angular-sector mean radial derivative magnitude of the radial-relative fiber tilt, over detected-object pixels in the sparse ring (dense_end .. sparse_end radii) region. Reported in degrees per pixel. 0 means the tilt stays constant while moving outward; larger values mean the local fiber field rotates relative to its radial spoke. The aggregation gives each occupied 10-degree angular sector equal weight. This is a field-level curvature measure, not parent-to-daughter branch tracking. |
|
|
Fraction of the 36 fixed 10-degree sectors in the canonical Overall annulus (core_end .. sparse_end) that contain at least three detected-structure pixels with structure-tensor coherence C >= 0.15. Dimensionless in [0, 1]. This is a density-sensitive quality diagnostic for interpreting radial tilt and outward turning, not an orientation phenotype. |
|
|
Fraction of the 36 fixed 10-degree sectors in the dense ring (core_end .. dense_end radii) region that contain at least three detected-structure pixels with structure-tensor coherence C >= 0.15. Dimensionless in [0, 1]. This is a density-sensitive quality diagnostic for interpreting radial tilt and outward turning, not an orientation phenotype. |
|
|
Fraction of the 36 fixed 10-degree sectors in the sparse ring (dense_end .. sparse_end radii) region that contain at least three detected-structure pixels with structure-tensor coherence C >= 0.15. Dimensionless in [0, 1]. This is a density-sensitive quality diagnostic for interpreting radial tilt and outward turning, not an orientation phenotype. |
|
|
Equal-cell mean absolute seam-safe axial change between matching 10-degree sectors in configured-width Sholl-style annular bands (8 pixels by default) whose centres are separated by the configured long-range lag (16 pixels by default). Ring pairs are assigned to the canonical Overall annulus (core_end .. sparse_end) region by their midpoint. Reported in degrees in [0, 90]. Annular bands begin outside the operational CoreZone. Each reliable ring-sector comparison contributes equally, so multiplying same-orientation branch evidence within an already reliable cell does not change its contribution. |
|
|
Equal-cell mean absolute seam-safe axial change between matching 10-degree sectors in configured-width Sholl-style annular bands (8 pixels by default) whose centres are separated by the configured long-range lag (16 pixels by default). Ring pairs are assigned to the dense ring (core_end .. dense_end radii) region by their midpoint. Reported in degrees in [0, 90]. Annular bands begin outside the operational CoreZone. Each reliable ring-sector comparison contributes equally, so multiplying same-orientation branch evidence within an already reliable cell does not change its contribution. |
|
|
Equal-cell mean absolute seam-safe axial change between matching 10-degree sectors in configured-width Sholl-style annular bands (8 pixels by default) whose centres are separated by the configured long-range lag (16 pixels by default). Ring pairs are assigned to the sparse ring (dense_end .. sparse_end radii) region by their midpoint. Reported in degrees in [0, 90]. Annular bands begin outside the operational CoreZone. Each reliable ring-sector comparison contributes equally, so multiplying same-orientation branch evidence within an already reliable cell does not change its contribution. |
|
|
Signed counterpart of LongRangeRotation over the canonical Overall annulus (core_end .. sparse_end), in degrees in [-90, 90]. Positive means the radial-relative fiber axis rotates clockwise and negative means counterclockwise while moving outward in image coordinates. Opposing reliable ring-sector changes cancel in this directional summary; inspect the absolute metric and support alongside it. |
|
|
Signed counterpart of LongRangeRotation over the dense ring (core_end .. dense_end radii) region, in degrees in [-90, 90]. Positive means the radial-relative fiber axis rotates clockwise and negative means counterclockwise while moving outward in image coordinates. Opposing reliable ring-sector changes cancel in this directional summary; inspect the absolute metric and support alongside it. |
|
|
Signed counterpart of LongRangeRotation over the sparse ring (dense_end .. sparse_end radii) region, in degrees in [-90, 90]. Positive means the radial-relative fiber axis rotates clockwise and negative means counterclockwise while moving outward in image coordinates. Opposing reliable ring-sector changes cancel in this directional summary; inspect the absolute metric and support alongside it. |
|
|
Fraction of fixed-lag ring-sector comparison cells assigned to the canonical Overall annulus (core_end .. sparse_end) that has reliable orientation estimates at both radii. Dimensionless in [0, 1]. This is a density-sensitive quality diagnostic, not an orientation phenotype. |
|
|
Fraction of fixed-lag ring-sector comparison cells assigned to the dense ring (core_end .. dense_end radii) region that have reliable orientation estimates at both radii. Dimensionless in [0, 1]. This is a density-sensitive quality diagnostic, not an orientation phenotype. |
|
|
Fraction of fixed-lag ring-sector comparison cells assigned to the sparse ring (dense_end .. sparse_end radii) region that have reliable orientation estimates at both radii. Dimensionless in [0, 1]. This is a density-sensitive quality diagnostic, not an orientation phenotype. |
|
|
Equal-sector mean absolute seam-safe axial difference between the broad Dense-zone and Sparse-zone radial-relative fiber means. Reported in degrees in [0, 90]. Only 10-degree sectors reliable in both zones contribute, and each paired sector receives equal weight. This measures accumulated zone-to-zone rotation without detecting individual branches. |
|
|
Signed mean Dense-to-Sparse axial change over paired reliable 10-degree sectors, in degrees in [-90, 90]. Positive means clockwise and negative means counterclockwise radial-relative rotation while moving outward in image coordinates. Opposing sector rotations cancel. |
|
|
Fraction of the 36 fixed 10-degree sectors with reliable radial-relative orientation estimates in both the Dense and Sparse zones. Dimensionless in [0, 1]. This is a density-sensitive quality diagnostic, not an orientation phenotype. |
|
|
Zone resolver provenance: 0 is legacy colony-ness, 1 is exact two-change Method B, 2 is collapsed one-change Method B, and 4 is canonical failure with missing zone measurements. This is a dimensionless categorical code. |
|
|
Outer radius in pixels of the operational CoreZone, which includes the inoculum and any inner region without resolvable branch orientation. |
|
|
Outer radius in pixels of the Method B DenseZone. It equals CoreZoneEndRadius for a collapsed one-change solution. |
|
|
Exact outer measurement radius in pixels selected by outer_zone_percentile. |
|
|
Maximum target-mask radius in pixels before percentile clipping. |
|
|
Configured target-mask radial percentile used as the canonical outer measurement boundary. This is a dimensionless percentage. |
|
|
Fraction of target-mask pixels at or inside the configured outer measurement boundary. This is a dimensionless fraction in [0, 1]. |
|
|
Fraction of center-origin rings satisfying the bridged Method B crossing, resultant, and coherence support gate. |
|
|
Within-segment sum of squared error for the selected exact or collapsed Method B partition in dimensionless standardized-feature units. |
|
|
Number of center-origin Sholl-style rings fitted by Method B. |
|
|
Configured minimum number of rings in each Method B segment. |
ORIENTATION_ZONE_PRIMARY#
Column label |
Description |
Type |
|---|---|---|
|
Largest rolling-median absolute cumulative rotation across consecutive supported literal skeleton-ring crossings from the CoreZone boundary through the configured SparseZone outer boundary. Reported in degrees, nonnegative with no fixed upper bound. The default three-ring window rejects a one-ring spike; NaN means no complete supported window. |
|
|
Largest rolling-median absolute cumulative rotation across consecutive supported literal skeleton-ring crossings from the CoreZone boundary to dense_end. Reported in degrees, nonnegative with no fixed upper bound. The default three-ring window rejects a one-ring spike; NaN means no complete supported window. |
|
|
Largest rolling-median absolute cumulative rotation across consecutive supported literal skeleton-ring crossings from dense_end through the configured SparseZone outer boundary. Reported in degrees, nonnegative with no fixed upper bound. The default three-ring window rejects a one-ring spike; NaN means no complete supported window. Cumulative rotation is not rebased at dense_end, so this Sparse magnitude may include rotation accumulated while the profile was in Dense. |
|
|
Outer endpoint median minus inner endpoint median of cumulative literal skeleton-ring rotation along the longest supported run from the inferred inoculum boundary through the configured SparseZone outer boundary. Reported in signed degrees with no fixed bounds; positive is clockwise and negative is counterclockwise while moving outward in image coordinates. NaN means the run is shorter than the configured minimum. |
|
|
Outer endpoint median minus inner endpoint median of cumulative literal skeleton-ring rotation along the longest supported run from the inferred inoculum boundary to dense_end. Reported in signed degrees with no fixed bounds; positive is clockwise and negative is counterclockwise while moving outward in image coordinates. NaN means the run is shorter than the configured minimum. |
|
|
Outer endpoint median minus inner endpoint median of cumulative literal skeleton-ring rotation along the longest supported run from dense_end through the configured SparseZone outer boundary. Reported in signed degrees with no fixed bounds; positive is clockwise and negative is counterclockwise while moving outward in image coordinates. NaN means the run is shorter than the configured minimum. Because this is a difference, cumulative rotation carried into Sparse cancels from the result. |
|
|
Median of all pairwise cumulative-rotation slopes along the longest supported literal skeleton-ring run from the CoreZone boundary through the configured SparseZone outer boundary. Reported in signed degrees per pixel; positive is clockwise and negative is counterclockwise while moving outward in image coordinates. NaN means the run is shorter than the configured minimum. |
|
|
Median of all pairwise cumulative-rotation slopes along the longest supported literal skeleton-ring run from the CoreZone boundary to dense_end. Reported in signed degrees per pixel; positive is clockwise and negative is counterclockwise while moving outward in image coordinates. NaN means the run is shorter than the configured minimum. |
|
|
Median of all pairwise cumulative-rotation slopes along the longest supported literal skeleton-ring run from dense_end through the full detected outer boundary. Reported in signed degrees per pixel; positive is clockwise and negative is counterclockwise while moving outward in image coordinates. NaN means the run is shorter than the configured minimum. The slope is unchanged by cumulative rotation carried into Sparse. |
|
|
Absolute Kendall tau-b association between radius and cumulative literal skeleton-ring rotation along the longest supported run from the inferred inoculum boundary through the configured SparseZone outer boundary. Dimensionless in [0, 1]; 1 is fully monotonic and values near 0 indicate reversals, plateaus, or no ordered trend. Direction is carried by the rotation rate. NaN means the run is shorter than the configured minimum. |
|
|
Absolute Kendall tau-b association between radius and cumulative literal skeleton-ring rotation along the longest supported run from the inferred inoculum boundary to dense_end. Dimensionless in [0, 1]; 1 is fully monotonic and values near 0 indicate reversals, plateaus, or no ordered trend. Direction is carried by the rotation rate. NaN means the run is shorter than the configured minimum. |
|
|
Absolute Kendall tau-b association between radius and cumulative literal skeleton-ring rotation along the longest supported run from dense_end through the configured SparseZone outer boundary. Dimensionless in [0, 1]; 1 is fully monotonic and values near 0 indicate reversals, plateaus, or no ordered trend. Direction is carried by the rotation rate, and the rank association is unchanged by rotation carried into Sparse. NaN means the run is shorter than the configured minimum. |
SYMMETRIC_ZONES#
Column label |
Description |
Type |
|---|---|---|
|
Radius of the dense inoculum core, determined by PELT changepoint detection on the radial mask-density profile centered on the inoculum. Growth measurements are reported relative to this boundary. |
|
|
Radial distance from the inoculum centroid at which colony growth ceases to be angularly uniform. Computed as the first radius past the core where the smoothed fraction of occupied angular sectors drops below the symmetry threshold. Equals the colony outer envelope when growth remains symmetric throughout. |
|
|
Mean distance of mask-boundary pixels from the inoculum centroid, measured from the core boundary outward. Captures the typical radial extent of growth past the inoculum, averaged over all angular directions. |
|
|
Maximum distance of any mask pixel from the inoculum centroid, measured from the core boundary outward. Captures the farthest extent of growth past the inoculum. |
|
|
Outer radius in pixels of CoreZone. Canonical Method B defines CoreZone as the inoculum plus any inner region without resolvable branch orientation. With legacy_mode=True, the historical colony-ness threshold defines this boundary. CoreRadius remains the independent mask-density PELT estimate. |
|
|
Outer radius in pixels of DenseZone. Canonical Method B uses its second change point; a collapsed one-change solution makes this equal to CoreEndRadius. Legacy mode uses the historical colony-ness threshold. |
|
|
Outer radius in pixels of SparseZone. Canonical Method B uses the exact target-mask radius selected by outer_zone_percentile; legacy mode uses the historical colony-ness and symmetric-envelope boundary. |
|
|
Pixel-squared area of CoreZone using the concentric CoreEndRadius circle. |
|
|
Pixel-squared area of DenseZone between CoreEndRadius and DenseEndRadius. It is zero for a collapsed canonical solution. |
|
|
Pixel-squared area of SparseZone between DenseEndRadius and SparseEndRadius. |
TEXTURE#
Column label |
Description |
Type |
|---|---|---|
|
|
|
|
|
|
|
|
|
|
|
|
|
|
|
|
|
|
|
|
|
|
|
|
|
|
|
|
|
|
|
|
|
|
|
|
|
|