

Run Locally#
The Run console drives a single CLI invocation as a subprocess of the GUI.
Stdout streams into a 5000-line ring buffer and onto disk under
<output_dir>/.gui_log/stdout.log; once the dashboard is written, an iframe
panel shows the live progress dashboard.
Open the run console#
Click the Run tab (or navigate to /run/):
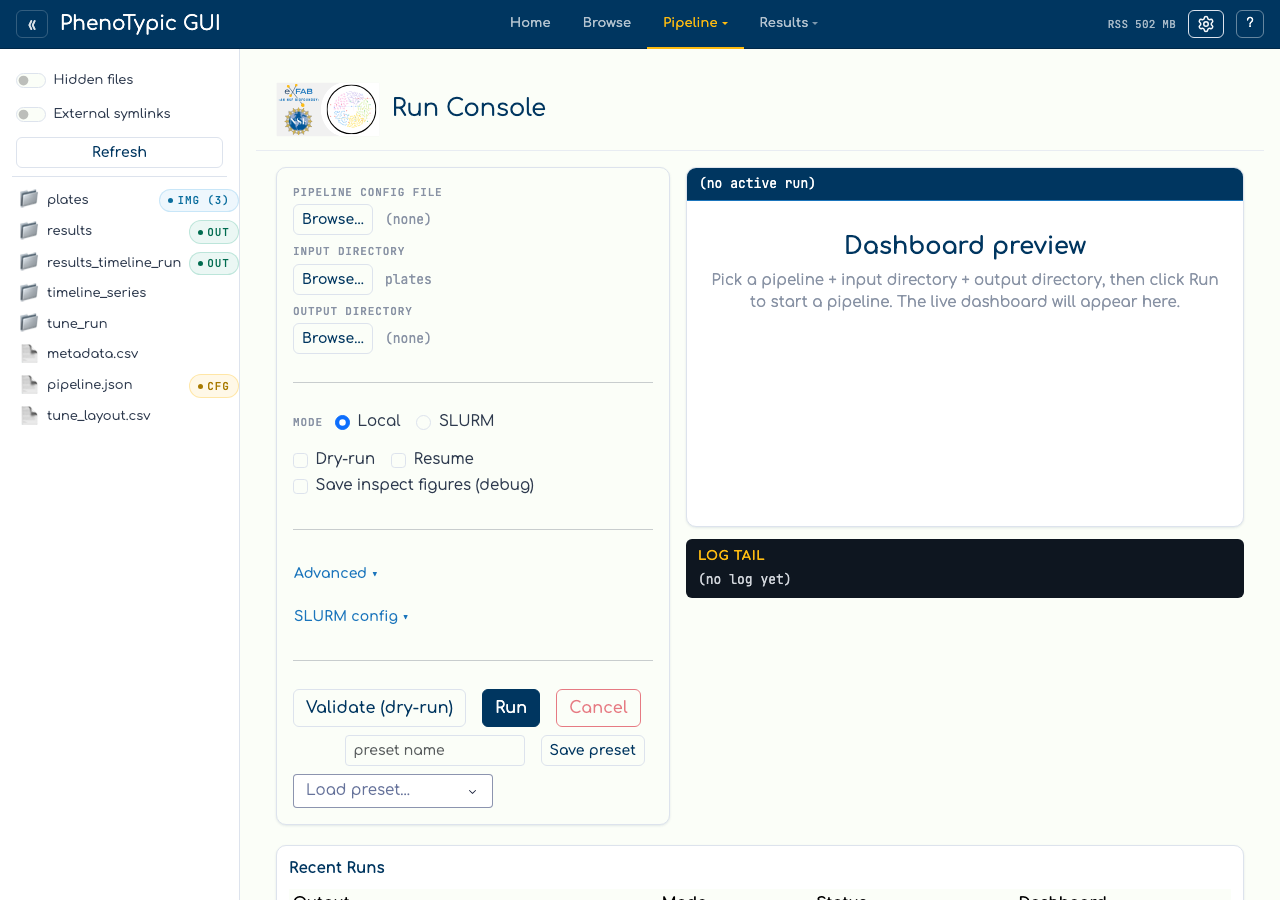
The form has three pickers (Pipeline JSON, Input directory, Output
directory), a Local/SLURM mode radio, two short-flag checkboxes (Dry-run and
Retry terminal failures), an Advanced collapse for the long-tail flags (--sample,
--nrows, --ncols, --image-type, Workers → --njobs), and a
SLURM config collapse covered on the next page.
The Log level field in Advanced is reserved — the GUI accepts a
value but the CLI does not currently expose --log-level, so the field
is a no-op until that flag lands. The
right pane shows the dashboard preview slot and the log tail.
Pick the pipeline and dataset#
You can fill in the pickers two ways:
From the sidebar (hand-off). Click pipeline.json.pht-pipe in the sidebar; the
hand-off banner above the form activates with Set as pipeline. Click it —
the picker label updates. Then click plates/ and use Set as input dir,
and finally choose a fresh output folder and use Set as output dir.
From the inline modal browser. Click any Browse… button. A modal
opens rooted at the sandbox:
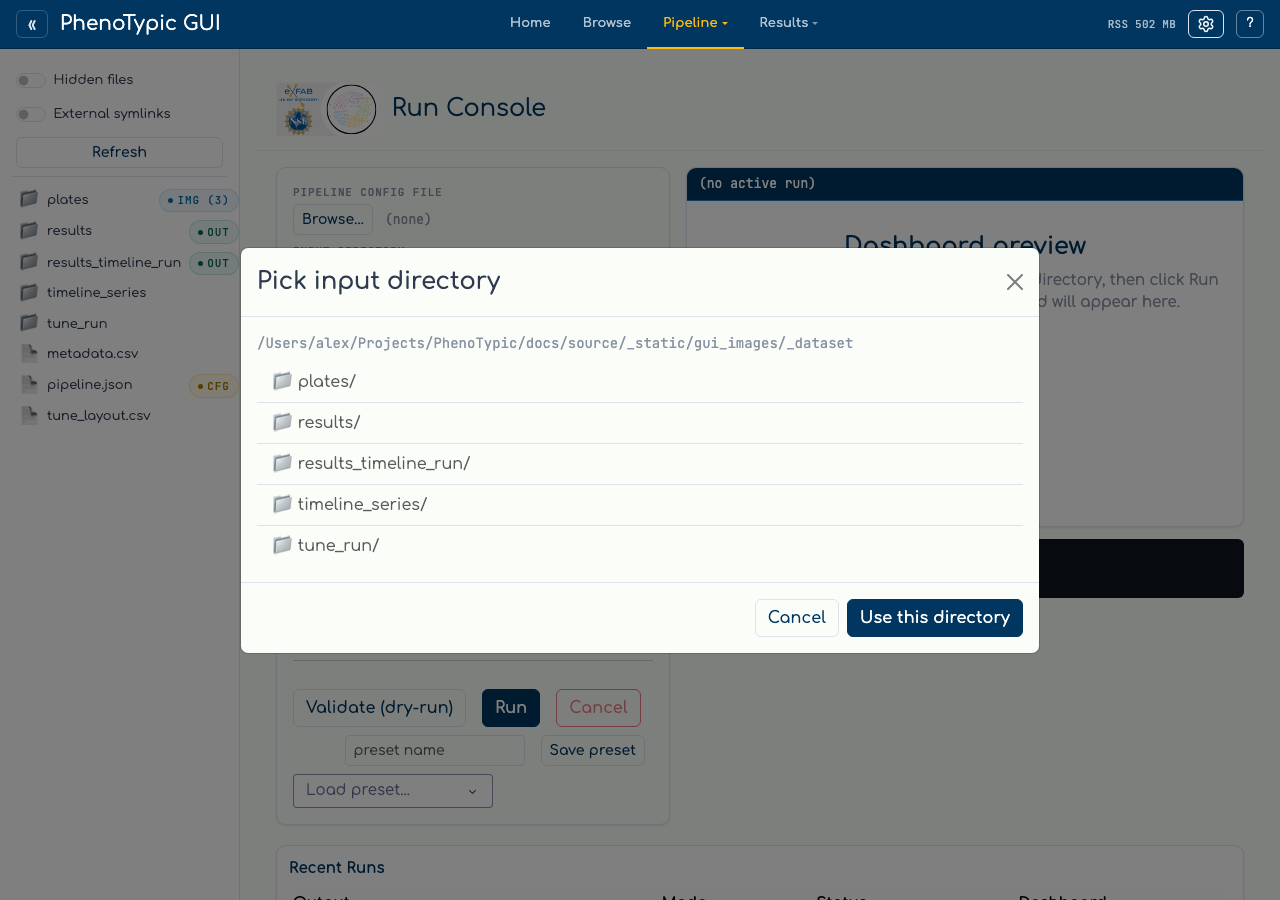
Click into the directory you want and use Use this directory. The modal
respects the same hidden-files / external-symlinks toggles as the sidebar.
Validate before running#
Validate (dry-run) spawns python -m phenotypic --mode full <args> --dry-run. The
CLI parses the pipeline JSON, lists the images it would process, then
exits without writing any output. The log tail shows the dry-run output.
Use this whenever you’re not sure the form values match what the CLI
expects — the dry-run takes seconds, a bad real run can waste minutes.
Validate and Run share one action path. The server durably records the run ID and generation UUID before it attempts a process spawn or scheduler submission. After the callback response reaches the page, the action notice displays that receipt. If acknowledgement is delayed or lost, the notice says the launch outcome is unknown and tells you not to submit again. Check Recent Runs and the selected output before taking further action.
Run#
Clicking Run spawns python -m phenotypic --mode full <args> (no --dry-run).
Repeating a compatible run automatically continues its existing lifecycle and
processes newly eligible work; there is no separate continuation checkbox.
While the subprocess is alive:
The log tail polls the ring buffer on a short interval. Lines arrive in order with stderr merged in.
Once the CLI writes
<output_dir>/deliverables/dashboard.html, the iframe panel points at/runs/<rel>/deliverables/dashboard.htmland the live progress dashboard renders directly, without a tab bar, inside the run console. Use the Results Viewer or/analysis/app after publication for result exploration.Only one local run can be active at a time; the
Runbutton stays disabled until the current run exits or you clickCancel(which sends SIGTERM, then SIGKILL after a 10-second grace period).
Every status, log, dashboard, and Cancel update is matched to the displayed run ID and generation. Cancel disables when that generation becomes terminal; its final status and log tail remain visible.
Recent Runs#
The Recent Runs panel below the form lists every run associated with this sandbox — both runs from the current session and historical runs rehydrated from the sandbox at boot time. The screenshot below shows the panel populated with the synthetic dataset’s run:
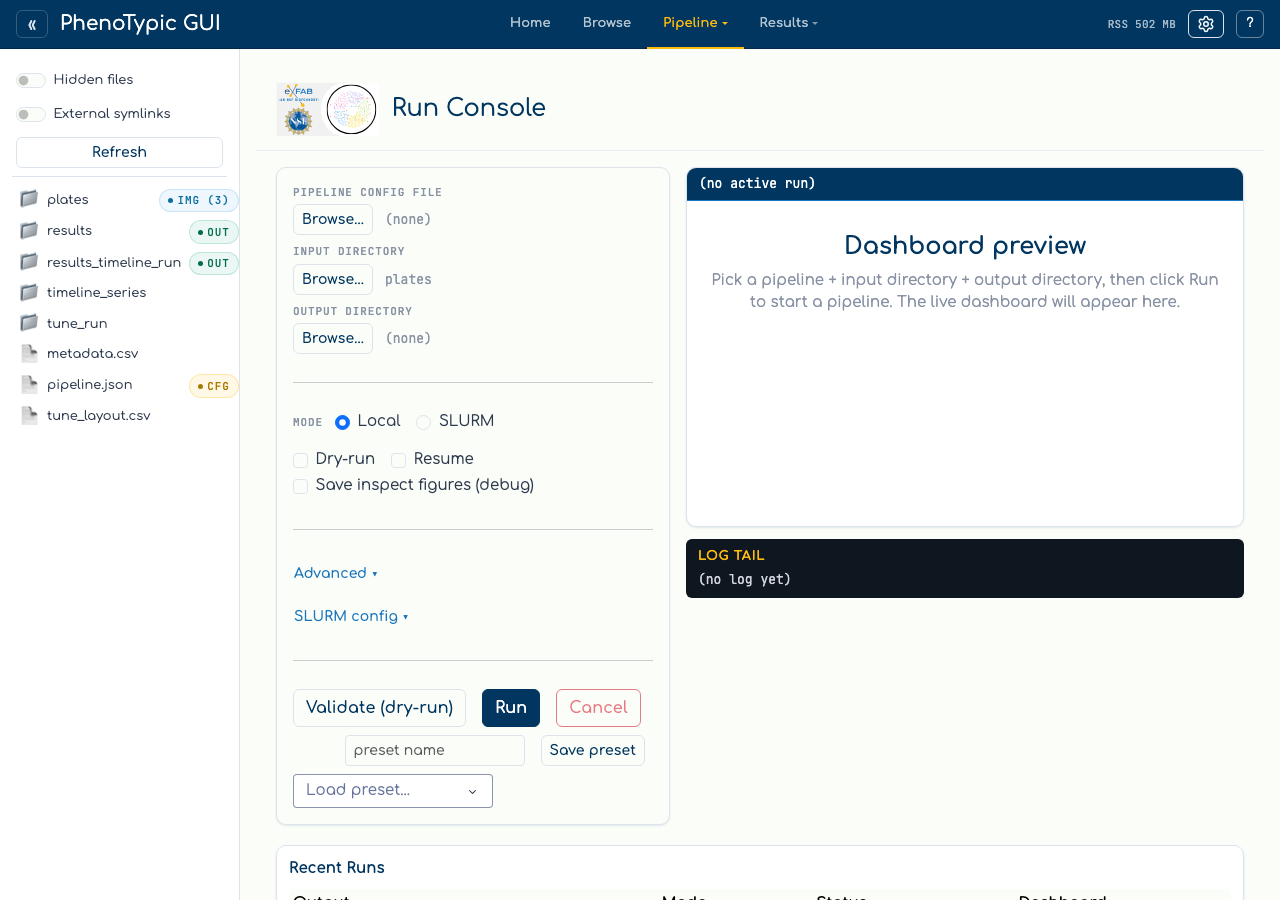
Each row carries the output directory, mode (local or slurm-<job-id>),
status (rendered uppercase by CSS, stored lowercase as one of queued,
reconciling, running, cancelling, complete, failed, cancelled,
unknown), and a Dashboard
indicator. Clicking a row re-points the iframe at that run’s dashboard
so you can re-visit historical results without leaving the page.
Ambient metadata selected in Settings is visible in the preflight but is not added to this Run automatically. Choose Include metadata to opt in, review the resolved image-identity column, and let preflight recheck that selection before launch.
The status comes from <output_dir>/.phenotypic/progress/manifest.json; the dashboard
indicator is true when deliverables/dashboard.html is present. The hub
registers a /runs/<rel>/<file> route on the shell’s Flask server so the
iframe URLs work regardless of which tab is currently active.
For SLURM submissions, see Run on SLURM.