5. Make your own ImagePipeline#
For a more detailed explanation on the components of phenotypic.Image and phenotypic.GridImage, see the {doc} Images and {doc} GridImages tutorial.
This tutorial demonstrates how to build and use image processing pipelines in PhenoTypic for automated analysis of arrayed microbial colonies on agar plates. It also discusses some of the caveats with the different steps
[1]:
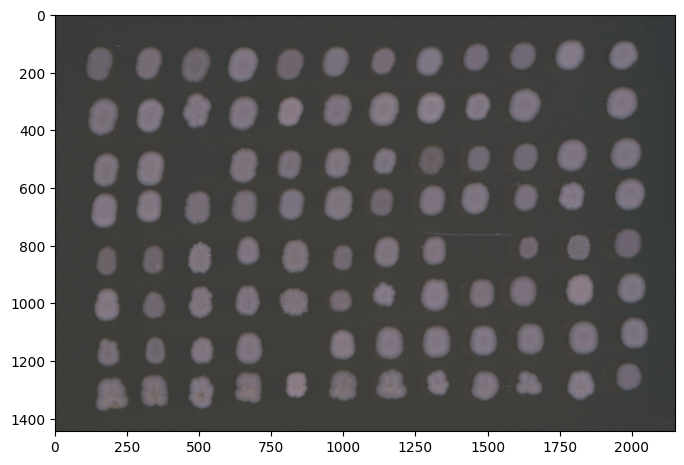
import phenotypic as pht

plate_image = pht.GridImage(pht.data.load_plate_72hr())
plate_image.show()
[1]:
(<Figure size 800x600 with 1 Axes>, <Axes: >)
Introduction to ImageOperations#
There are 4 main types of ImageOperationss:
ImageCorrection: These are operations that preserve or improve data integrity and analysis resultsImageEnhancement: These don’t preserve data integrity, so they are applied to theenh_grayrepresentation of the image because they improve detection results.ObjectDetection: These read thergb(for color based detection) orenh_grayproperty of the Image in order to assign pixels to objects in an image
Preprocessing Layer#
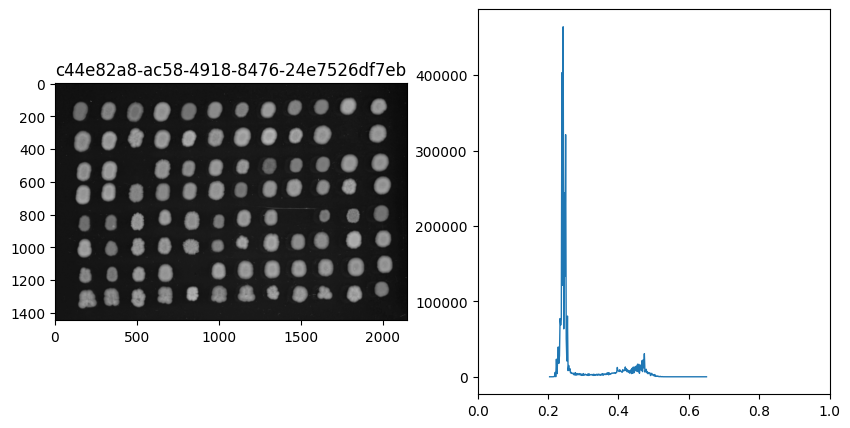
[2]:
plate_image.enh_gray.histogram()
[2]:
(<Figure size 1000x500 with 2 Axes>,
 array([(<Figure size 1000x500 with 2 Axes>, <Axes: title={'center': 'c44e82a8-ac58-4918-8476-24e7526df7eb'}>),
        <Axes: >], dtype=object))
[ ]:
from phenotypic.enhance import BM3DDenoiser
from phenotypic.detect import RoundPeaksDetector

from phenotypic import ImagePipeline

pipe = ImagePipeline(
        ops=[
            BM3DDenoiser(),
            RoundPeaksDetector(),
        ]
)

test_image = pipe.apply(plate_image)
test_image.show_overlay()
From the histogram, we can see that the contrast is not being maximized, since the minimum value is at 0.2 and the highest value is around 6.5. The full range of grayscale values is from 0-1. Many detection algorithms rely on a bimodal distribution of intensity to separate the foreground and background. Thus, we should enhance the contrast to improve detection.
[ ]:
from phenotypic.enhance import GaussianBlur

blur = GaussianBlur()
blur.widget(plate_image)
[4]:
from phenotypic.prefab import HeavyWatershedPipeline

kmarx_pipeline = HeavyWatershedPipeline()

# Lets use the widget to fine-tune parameters
kmarx_pipeline.widget()
[4]:
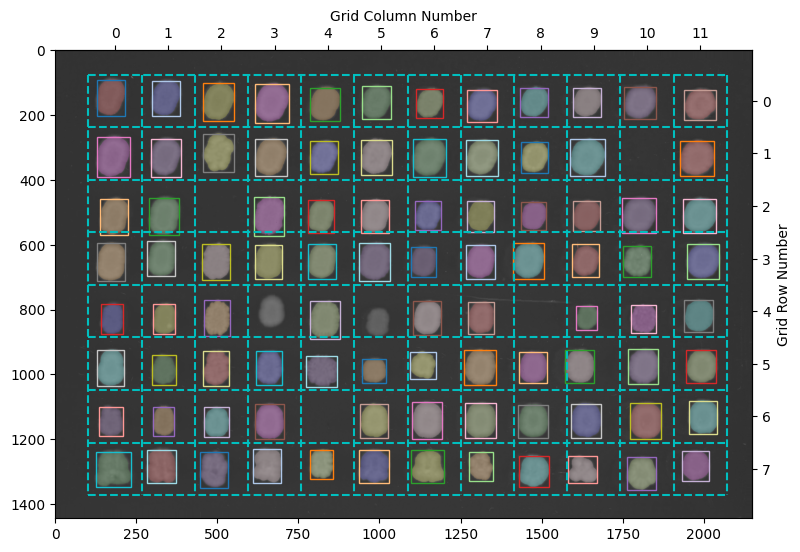
[ ]:
pipeline_output = kmarx_pipeline.apply(plate_image)
pipeline_output.objects.relabel()
pipeline_output.show_overlay()
(<Figure size 900x1000 with 1 Axes>, <Axes: >)
[6]:
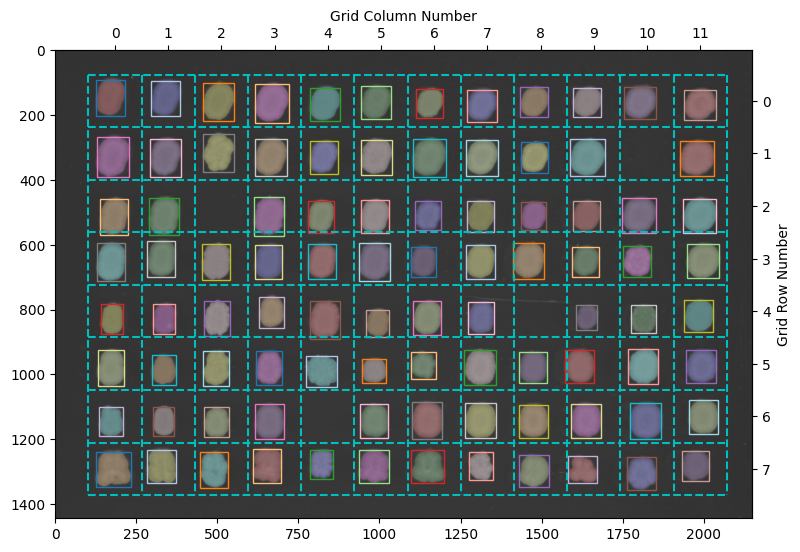
from phenotypic.prefab import HeavyWatershedPipeline

pipeline_output2 = HeavyWatershedPipeline().apply(plate_image)
pipeline_output2.show_overlay()
[6]:
(<Figure size 900x1000 with 1 Axes>, <Axes: >)
[7]:
pipeline_output.enh_gray.histogram()
[7]:
(<Figure size 1000x500 with 2 Axes>,
 array([(<Figure size 1000x500 with 2 Axes>, <Axes: title={'center': 'e8a77428-634d-4c07-b09c-c725464d6b32'}>),
        <Axes: >], dtype=object))
[8]:
pipeline_meas = kmarx_pipeline.measure(pipeline_output, include_metadata=False)
pipeline_meas
[8]:
| ObjectLabel | Bbox_CenterRR | Bbox_CenterCC | Bbox_MinRR | Bbox_MinCC | Bbox_MaxRR | Bbox_MaxCC | Grid_RowNum | Grid_ColNum | Grid_SectionNum | ... | TextureGray_HaralickVariance-avg-scale04 | TextureGray_InverseDifferenceMoment-avg-scale04 | TextureGray_SumAverage-avg-scale04 | TextureGray_SumVariance-avg-scale04 | TextureGray_SumEntropy-avg-scale04 | TextureGray_Entropy-avg-scale04 | TextureGray_DiffVariance-avg-scale04 | TextureGray_DiffEntropy-avg-scale04 | TextureGray_InfoCorrelation1-avg-scale04 | TextureGray_InfoCorrelation2-avg-scale04 | |
|---|---|---|---|---|---|---|---|---|---|---|---|---|---|---|---|---|---|---|---|---|---|
| 0 | 1 | 146.506703 | 170.569699 | 91 | 128 | 204 | 216 | 0 | 0 | 0 | ... | 0.227501 | 0.917104 | 23.561500 | 0.725170 | 1.245760 | 1.447084 | 0.044131 | 0.675382 | -0.292161 | 0.617447 |
| 1 | 2 | 149.396380 | 340.542659 | 97 | 298 | 204 | 386 | 0 | 1 | 1 | ... | 0.738942 | 0.779646 | 25.834356 | 2.456797 | 2.475868 | 2.975292 | 0.028841 | 1.102396 | -0.263979 | 0.763785 |
| 2 | 3 | 160.823387 | 503.184827 | 103 | 456 | 218 | 552 | 0 | 2 | 2 | ... | 0.491629 | 0.844037 | 24.416443 | 1.642722 | 2.198116 | 2.531479 | 0.035992 | 0.916609 | -0.294202 | 0.753914 |
| 3 | 4 | 163.507507 | 667.136392 | 105 | 616 | 224 | 720 | 0 | 3 | 3 | ... | 1.169566 | 0.787356 | 27.764862 | 4.112562 | 2.690033 | 3.187108 | 0.026823 | 1.193745 | -0.348834 | 0.855079 |
| 4 | 5 | 162.581936 | 988.687380 | 112 | 945 | 214 | 1035 | 0 | 5 | 5 | ... | 1.006358 | 0.829287 | 26.639336 | 3.560625 | 2.155954 | 2.585183 | 0.032185 | 1.086397 | -0.390953 | 0.841887 |
| ... | ... | ... | ... | ... | ... | ... | ... | ... | ... | ... | ... | ... | ... | ... | ... | ... | ... | ... | ... | ... | ... |
| 85 | 86 | 1293.937771 | 489.301356 | 1239 | 448 | 1349 | 532 | 7 | 2 | 86 | ... | 1.108200 | 0.742637 | 27.649365 | 3.755580 | 2.774204 | 3.409272 | 0.024679 | 1.263264 | -0.269797 | 0.802120 |
| 86 | 87 | 1284.021505 | 1311.323189 | 1239 | 1275 | 1328 | 1350 | 7 | 7 | 91 | ... | 1.370031 | 0.729467 | 27.969614 | 4.622844 | 2.764216 | 3.452672 | 0.021514 | 1.404993 | -0.260746 | 0.795513 |
| 87 | 88 | 1298.299929 | 1475.423016 | 1250 | 1430 | 1348 | 1523 | 7 | 8 | 92 | ... | 1.242901 | 0.774189 | 27.577465 | 4.450449 | 2.823792 | 3.349485 | 0.026872 | 1.125120 | -0.352028 | 0.868454 |
| 88 | 89 | 1296.660489 | 1624.861193 | 1252 | 1582 | 1335 | 1670 | 7 | 9 | 93 | ... | 1.464127 | 0.724083 | 27.086165 | 5.091357 | 2.989982 | 3.669252 | 0.023581 | 1.321775 | -0.301962 | 0.848755 |
| 89 | 90 | 1305.486899 | 1806.938209 | 1256 | 1762 | 1357 | 1853 | 7 | 10 | 94 | ... | 1.332574 | 0.771103 | 28.552207 | 4.697378 | 2.657524 | 3.214988 | 0.024217 | 1.250490 | -0.333007 | 0.845963 |
90 rows × 233 columns
[9]:
pipeline_output.rgb.show()
[9]:
(<Figure size 800x600 with 1 Axes>, <Axes: >)
[10]:
fig, ax = pipeline_output.show_overlay()

[11]:
pipeline_output.objmask.show()
[11]:
(<Figure size 800x600 with 1 Axes>, <Axes: >)
[12]:
pipeline_output.grid.info()
[12]:
| Metadata_BitDepth | Metadata_ImageType | Metadata_ImageName | ObjectLabel | Bbox_CenterRR | Bbox_CenterCC | Bbox_MinRR | Bbox_MinCC | Bbox_MaxRR | Bbox_MaxCC | Grid_RowNum | Grid_ColNum | Grid_SectionNum | |
|---|---|---|---|---|---|---|---|---|---|---|---|---|---|
| 0 | 8 | GridImage | e8a77428-634d-4c07-b09c-c725464d6b32 | 1 | 146.506703 | 170.569699 | 91 | 128 | 204 | 216 | 0 | 0 | 0 |
| 1 | 8 | GridImage | e8a77428-634d-4c07-b09c-c725464d6b32 | 2 | 149.396380 | 340.542659 | 97 | 298 | 204 | 386 | 0 | 1 | 1 |
| 2 | 8 | GridImage | e8a77428-634d-4c07-b09c-c725464d6b32 | 3 | 160.823387 | 503.184827 | 103 | 456 | 218 | 552 | 0 | 2 | 2 |
| 3 | 8 | GridImage | e8a77428-634d-4c07-b09c-c725464d6b32 | 4 | 163.507507 | 667.136392 | 105 | 616 | 224 | 720 | 0 | 3 | 3 |
| 4 | 8 | GridImage | e8a77428-634d-4c07-b09c-c725464d6b32 | 5 | 162.581936 | 988.687380 | 112 | 945 | 214 | 1035 | 0 | 5 | 5 |
| ... | ... | ... | ... | ... | ... | ... | ... | ... | ... | ... | ... | ... | ... |
| 85 | 8 | GridImage | e8a77428-634d-4c07-b09c-c725464d6b32 | 86 | 1293.937771 | 489.301356 | 1239 | 448 | 1349 | 532 | 7 | 2 | 86 |
| 86 | 8 | GridImage | e8a77428-634d-4c07-b09c-c725464d6b32 | 87 | 1284.021505 | 1311.323189 | 1239 | 1275 | 1328 | 1350 | 7 | 7 | 91 |
| 87 | 8 | GridImage | e8a77428-634d-4c07-b09c-c725464d6b32 | 88 | 1298.299929 | 1475.423016 | 1250 | 1430 | 1348 | 1523 | 7 | 8 | 92 |
| 88 | 8 | GridImage | e8a77428-634d-4c07-b09c-c725464d6b32 | 89 | 1296.660489 | 1624.861193 | 1252 | 1582 | 1335 | 1670 | 7 | 9 | 93 |
| 89 | 8 | GridImage | e8a77428-634d-4c07-b09c-c725464d6b32 | 90 | 1305.486899 | 1806.938209 | 1256 | 1762 | 1357 | 1853 | 7 | 10 | 94 |
90 rows × 13 columns
[13]:
shape_measurements = MeasureShape().measure(pipeline_output)
shape_measurements
[13]:
| ObjectLabel | Shape_Area | Shape_Perimeter | Shape_Circularity | Shape_ConvexArea | Shape_MedianRadius | Shape_MeanRadius | Shape_MaxRadius | Shape_MinFeretDiameter | Shape_MaxFeretDiameter | Shape_Eccentricity | Shape_Solidity | Shape_Extent | Shape_BboxArea | Shape_MajorAxisLength | Shape_MinorAxisLength | Shape_Compactness | Shape_Orientation | |
|---|---|---|---|---|---|---|---|---|---|---|---|---|---|---|---|---|---|---|
| 0 | 1 | 7683.0 | 335.563492 | 0.857415 | 317.616082 | 14.142136 | 15.782705 | 41.048752 | 82.443454 | 112.946890 | 0.688207 | 24.189581 | 0.772627 | 9944.0 | 116.287931 | 84.368585 | 1.166296 | -0.301111 |
| 1 | 2 | 7349.0 | 328.492424 | 0.855830 | 309.802847 | 13.928388 | 15.490497 | 40.718546 | 81.270536 | 110.208893 | 0.672004 | 23.721538 | 0.780480 | 9416.0 | 112.570343 | 83.363638 | 1.168457 | -0.346249 |
| 2 | 3 | 8278.0 | 347.948268 | 0.859223 | 328.849209 | 14.764823 | 16.493031 | 43.863424 | 87.862531 | 116.468880 | 0.642563 | 25.172632 | 0.749819 | 11040.0 | 117.424997 | 89.974903 | 1.163842 | -0.392919 |
| 3 | 4 | 9458.0 | 371.019336 | 0.863408 | 349.273610 | 16.000000 | 17.849295 | 48.010416 | 95.703709 | 122.114700 | 0.609198 | 27.079057 | 0.764221 | 12376.0 | 123.330059 | 97.802935 | 1.158201 | -0.400819 |
| 4 | 5 | 7274.0 | 321.078210 | 0.886669 | 305.533007 | 14.000000 | 15.731636 | 42.059482 | 84.970583 | 107.540690 | 0.601665 | 23.807575 | 0.792375 | 9180.0 | 107.762019 | 86.074754 | 1.127817 | -0.429974 |
| ... | ... | ... | ... | ... | ... | ... | ... | ... | ... | ... | ... | ... | ... | ... | ... | ... | ... | ... |
| 85 | 86 | 7151.0 | 328.492424 | 0.832772 | 309.230424 | 13.416408 | 14.925836 | 39.293765 | 80.445199 | 109.457754 | 0.672877 | 23.125150 | 0.773918 | 9240.0 | 111.295764 | 82.331500 | 1.200809 | 0.026111 |
| 86 | 87 | 4929.0 | 271.178716 | 0.842282 | 255.516412 | 11.180340 | 12.558015 | 34.000000 | 71.975989 | 88.566359 | 0.577093 | 19.290346 | 0.738427 | 6675.0 | 88.080214 | 71.933216 | 1.187251 | 0.189082 |
| 87 | 88 | 6995.0 | 317.078210 | 0.874309 | 299.816627 | 13.601471 | 15.440377 | 43.104524 | 87.467796 | 99.824847 | 0.440490 | 23.330928 | 0.767501 | 9114.0 | 99.870924 | 89.659878 | 1.143761 | -0.365050 |
| 88 | 89 | 5396.0 | 294.592929 | 0.781335 | 273.725269 | 11.180340 | 12.340611 | 33.541020 | 79.881659 | 95.131488 | 0.497171 | 19.713196 | 0.738773 | 7304.0 | 90.984682 | 78.943092 | 1.279861 | 0.962156 |
| 89 | 90 | 7137.0 | 321.320851 | 0.868656 | 303.153796 | 13.892444 | 15.581754 | 43.266615 | 90.000000 | 101.980390 | 0.443792 | 23.542506 | 0.776521 | 9191.0 | 100.914223 | 90.432267 | 1.151204 | -0.193597 |
90 rows × 18 columns
[14]:
intensity_measurements = MeasureIntensity().measure(pipeline_output)
intensity_measurements
[14]:
| ObjectLabel | Intensity_IntegratedIntensity | Intensity_MinimumIntensity | Intensity_MaximumIntensity | Intensity_MeanIntensity | Intensity_MedianIntensity | Intensity_StandardDeviationIntensity | Intensity_CoefficientVarianceIntensity | Intensity_LowerQuartileIntensity | Intensity_UpperQuartileIntensity | Intensity_InterquartileRangeIntensity | |
|---|---|---|---|---|---|---|---|---|---|---|---|
| 0 | 1 | 2958.221342 | 0.315973 | 0.447028 | 0.385035 | 0.393280 | 0.018061 | 0.046913 | 0.376440 | 0.398012 | 0.021572 |
| 1 | 2 | 3051.176300 | 0.320162 | 0.450094 | 0.415183 | 0.424600 | 0.027032 | 0.065118 | 0.400252 | 0.434407 | 0.034155 |
| 2 | 3 | 3272.532053 | 0.328571 | 0.435546 | 0.395329 | 0.398831 | 0.021133 | 0.053463 | 0.386255 | 0.412017 | 0.025762 |
| 3 | 4 | 4201.881607 | 0.312051 | 0.483713 | 0.444267 | 0.458502 | 0.035672 | 0.080303 | 0.428522 | 0.470267 | 0.041745 |
| 4 | 5 | 3086.875557 | 0.310102 | 0.457401 | 0.424371 | 0.442251 | 0.032696 | 0.077056 | 0.407827 | 0.448993 | 0.041165 |
| ... | ... | ... | ... | ... | ... | ... | ... | ... | ... | ... | ... |
| 85 | 86 | 3162.189429 | 0.327134 | 0.499667 | 0.442202 | 0.453435 | 0.033906 | 0.076686 | 0.421029 | 0.469702 | 0.048673 |
| 86 | 87 | 2198.213529 | 0.319291 | 0.508597 | 0.445976 | 0.458502 | 0.039786 | 0.089229 | 0.423514 | 0.476123 | 0.052609 |
| 87 | 88 | 3087.983356 | 0.334977 | 0.497153 | 0.441456 | 0.454581 | 0.035957 | 0.081463 | 0.415938 | 0.469955 | 0.054016 |
| 88 | 89 | 2332.659890 | 0.304446 | 0.489875 | 0.432294 | 0.445071 | 0.039725 | 0.091911 | 0.406375 | 0.465497 | 0.059122 |
| 89 | 90 | 3259.061913 | 0.332730 | 0.513404 | 0.456643 | 0.472202 | 0.039956 | 0.087512 | 0.433306 | 0.485953 | 0.052647 |
90 rows × 11 columns
[15]:
texture_measurements = MeasureTexture().measure(pipeline_output)
texture_measurements
[15]:
| ObjectLabel | TextureGray_AngularSecondMoment-deg000-scale05 | TextureGray_AngularSecondMoment-deg045-scale05 | TextureGray_AngularSecondMoment-deg090-scale05 | TextureGray_AngularSecondMoment-deg135-scale05 | TextureGray_Contrast-deg000-scale05 | TextureGray_Contrast-deg045-scale05 | TextureGray_Contrast-deg090-scale05 | TextureGray_Contrast-deg135-scale05 | TextureGray_Correlation-deg000-scale05 | ... | TextureGray_HaralickVariance-avg-scale05 | TextureGray_InverseDifferenceMoment-avg-scale05 | TextureGray_SumAverage-avg-scale05 | TextureGray_SumVariance-avg-scale05 | TextureGray_SumEntropy-avg-scale05 | TextureGray_Entropy-avg-scale05 | TextureGray_DiffVariance-avg-scale05 | TextureGray_DiffEntropy-avg-scale05 | TextureGray_InfoCorrelation1-avg-scale05 | TextureGray_InfoCorrelation2-avg-scale05 | |
|---|---|---|---|---|---|---|---|---|---|---|---|---|---|---|---|---|---|---|---|---|---|
| 0 | 1 | 0.558316 | 0.552814 | 0.569642 | 0.555018 | 0.202443 | 0.259023 | 0.168024 | 0.234774 | 0.540176 | ... | 0.221875 | 0.905335 | 23.580289 | 0.671432 | 1.232740 | 1.465662 | 0.042211 | 0.737523 | -0.225150 | 0.545807 |
| 1 | 2 | 0.180660 | 0.163941 | 0.191922 | 0.174283 | 0.554479 | 0.847697 | 0.458532 | 0.673436 | 0.616016 | ... | 0.725754 | 0.745372 | 25.873170 | 2.269480 | 2.452135 | 3.064197 | 0.026551 | 1.217151 | -0.188587 | 0.670832 |
| 2 | 3 | 0.213661 | 0.185136 | 0.234503 | 0.205185 | 0.366597 | 0.532718 | 0.306311 | 0.419312 | 0.621316 | ... | 0.483086 | 0.813174 | 24.444996 | 1.526108 | 2.198214 | 2.627109 | 0.032960 | 1.017509 | -0.213103 | 0.668218 |
| 3 | 4 | 0.166461 | 0.140866 | 0.179679 | 0.156046 | 0.613354 | 0.927427 | 0.567785 | 0.821248 | 0.735854 | ... | 1.141829 | 0.752739 | 27.813244 | 3.834864 | 2.685786 | 3.288824 | 0.024422 | 1.320849 | -0.273127 | 0.795296 |
| 4 | 5 | 0.318597 | 0.310354 | 0.329535 | 0.316081 | 0.472649 | 0.787006 | 0.475967 | 0.669784 | 0.763881 | ... | 0.983710 | 0.804831 | 26.687383 | 3.333487 | 2.139127 | 2.643253 | 0.029743 | 1.204538 | -0.325100 | 0.795182 |
| ... | ... | ... | ... | ... | ... | ... | ... | ... | ... | ... | ... | ... | ... | ... | ... | ... | ... | ... | ... | ... | ... |
| 85 | 86 | 0.127250 | 0.115386 | 0.133147 | 0.112571 | 0.722618 | 1.014710 | 0.661861 | 1.100062 | 0.670634 | ... | 1.093264 | 0.702715 | 27.693580 | 3.498243 | 2.751854 | 3.512981 | 0.022611 | 1.387838 | -0.200732 | 0.725343 |
| 86 | 87 | 0.146381 | 0.138619 | 0.151912 | 0.132298 | 0.888765 | 1.287120 | 0.890989 | 1.398475 | 0.671933 | ... | 1.347841 | 0.694853 | 28.026835 | 4.275028 | 2.735261 | 3.548868 | 0.019423 | 1.545692 | -0.187574 | 0.709476 |
| 87 | 88 | 0.127455 | 0.114668 | 0.141462 | 0.118292 | 0.570484 | 0.827449 | 0.505204 | 0.767981 | 0.767711 | ... | 1.218594 | 0.736096 | 27.629801 | 4.206596 | 2.812881 | 3.446993 | 0.024862 | 1.240555 | -0.288303 | 0.823123 |
| 88 | 89 | 0.114170 | 0.096859 | 0.111693 | 0.101273 | 0.703868 | 1.123439 | 0.863260 | 1.267260 | 0.758194 | ... | 1.444939 | 0.681765 | 27.143958 | 4.790298 | 2.969049 | 3.776369 | 0.021634 | 1.446004 | -0.236735 | 0.790989 |
| 89 | 90 | 0.217465 | 0.204218 | 0.225225 | 0.204146 | 0.646261 | 0.988345 | 0.652948 | 0.995350 | 0.758458 | ... | 1.301592 | 0.738221 | 28.608124 | 4.385640 | 2.639700 | 3.295845 | 0.021955 | 1.383115 | -0.267188 | 0.792273 |
90 rows × 66 columns
[16]:
single_object = pipeline_output.objects[-1]
fig, ax = single_object.show_overlay()
[17]:
color_measurements = MeasureColor().measure(pipeline_output)
color_measurements
[17]:
| ObjectLabel | Colorxy_xMin | Colorxy_xQ1 | Colorxy_xMean | Colorxy_xMedian | Colorxy_xQ3 | Colorxy_xMax | Colorxy_xStdDev | Colorxy_xCoeffVar | Colorxy_yMin | ... | ColorHSV_BrightnessMin | ColorHSV_BrightnessQ1 | ColorHSV_BrightnessMean | ColorHSV_BrightnessMedian | ColorHSV_BrightnessQ3 | ColorHSV_BrightnessMax | ColorHSV_BrightnessStdDev | ColorHSV_BrightnessCoeffVar | ColorLab_ChromaEstimatedMean | ColorLab_ChromaEstimatedMedian | |
|---|---|---|---|---|---|---|---|---|---|---|---|---|---|---|---|---|---|---|---|---|---|
| 0 | 1 | 0.307992 | 0.311256 | 0.312193 | 0.312423 | 0.312431 | 0.320497 | 0.001298 | 0.004157 | 0.315938 | ... | 0.325490 | 0.400000 | 0.409941 | 0.415686 | 0.427451 | 0.466667 | 0.022148 | 0.054034 | 3.882206 | 3.840626 |
| 1 | 2 | 0.306805 | 0.312447 | 0.313282 | 0.313721 | 0.314293 | 0.320497 | 0.001651 | 0.005272 | 0.316489 | ... | 0.329412 | 0.427451 | 0.442559 | 0.454902 | 0.462745 | 0.478431 | 0.029886 | 0.067539 | 4.030819 | 4.304368 |
| 2 | 3 | 0.309151 | 0.312437 | 0.313206 | 0.313051 | 0.314274 | 0.319059 | 0.001407 | 0.004494 | 0.316610 | ... | 0.341176 | 0.407843 | 0.418482 | 0.423529 | 0.435294 | 0.458824 | 0.023953 | 0.057245 | 3.552761 | 3.638739 |
| 3 | 4 | 0.305788 | 0.310754 | 0.311901 | 0.312594 | 0.312598 | 0.321360 | 0.001937 | 0.006212 | 0.315381 | ... | 0.321569 | 0.458824 | 0.475757 | 0.494118 | 0.501961 | 0.525490 | 0.039734 | 0.083527 | 4.330965 | 4.678852 |
| 4 | 5 | 0.305485 | 0.310342 | 0.311700 | 0.311406 | 0.312456 | 0.322472 | 0.002012 | 0.006457 | 0.314306 | ... | 0.325490 | 0.435294 | 0.455866 | 0.474510 | 0.482353 | 0.498039 | 0.038618 | 0.084725 | 4.269135 | 4.652391 |
| ... | ... | ... | ... | ... | ... | ... | ... | ... | ... | ... | ... | ... | ... | ... | ... | ... | ... | ... | ... | ... | ... |
| 85 | 86 | 0.306004 | 0.311406 | 0.313270 | 0.312598 | 0.314267 | 0.328517 | 0.003480 | 0.011109 | 0.315243 | ... | 0.345098 | 0.454902 | 0.474502 | 0.486275 | 0.501961 | 0.533333 | 0.037547 | 0.079139 | 3.950601 | 4.213721 |
| 86 | 87 | 0.305674 | 0.311417 | 0.312889 | 0.312599 | 0.314307 | 0.321468 | 0.002678 | 0.008559 | 0.315241 | ... | 0.333333 | 0.450980 | 0.478372 | 0.494118 | 0.513725 | 0.552941 | 0.045051 | 0.094196 | 4.162647 | 4.321553 |
| 87 | 88 | 0.307119 | 0.312431 | 0.313232 | 0.312602 | 0.314243 | 0.320409 | 0.001957 | 0.006248 | 0.315775 | ... | 0.349020 | 0.443137 | 0.470576 | 0.486275 | 0.501961 | 0.533333 | 0.039857 | 0.084710 | 3.974293 | 4.193629 |
| 88 | 89 | 0.305485 | 0.310456 | 0.312269 | 0.312463 | 0.313704 | 0.320966 | 0.002399 | 0.007685 | 0.315569 | ... | 0.317647 | 0.431373 | 0.461090 | 0.478431 | 0.498039 | 0.533333 | 0.045196 | 0.098038 | 3.755356 | 3.815770 |
| 89 | 90 | 0.303893 | 0.310492 | 0.312114 | 0.312600 | 0.313632 | 0.320771 | 0.002420 | 0.007754 | 0.314794 | ... | 0.349020 | 0.466667 | 0.488994 | 0.505882 | 0.521569 | 0.545098 | 0.043478 | 0.088925 | 4.174381 | 4.426421 |
90 rows × 67 columns
[ ]:
pipeline_measurements = kmarx_pipeline.measure(pipeline_output, include_metadata=False)
pipeline_measurements
| ObjectLabel | Bbox_CenterRR | Bbox_CenterCC | Bbox_MinRR | Bbox_MinCC | Bbox_MaxRR | Bbox_MaxCC | Grid_RowNum | Grid_ColNum | Grid_SectionNum | ... | TextureGray_HaralickVariance-avg-scale04 | TextureGray_InverseDifferenceMoment-avg-scale04 | TextureGray_SumAverage-avg-scale04 | TextureGray_SumVariance-avg-scale04 | TextureGray_SumEntropy-avg-scale04 | TextureGray_Entropy-avg-scale04 | TextureGray_DiffVariance-avg-scale04 | TextureGray_DiffEntropy-avg-scale04 | TextureGray_InfoCorrelation1-avg-scale04 | TextureGray_InfoCorrelation2-avg-scale04 | |
|---|---|---|---|---|---|---|---|---|---|---|---|---|---|---|---|---|---|---|---|---|---|
| 0 | 1 | 146.506703 | 170.569699 | 91 | 128 | 204 | 216 | 0 | 0 | 0 | ... | 0.227501 | 0.917104 | 23.561500 | 0.725170 | 1.245760 | 1.447084 | 0.044131 | 0.675382 | -0.292161 | 0.617447 |
| 1 | 2 | 149.396380 | 340.542659 | 97 | 298 | 204 | 386 | 0 | 1 | 1 | ... | 0.738942 | 0.779646 | 25.834356 | 2.456797 | 2.475868 | 2.975292 | 0.028841 | 1.102396 | -0.263979 | 0.763785 |
| 2 | 3 | 160.823387 | 503.184827 | 103 | 456 | 218 | 552 | 0 | 2 | 2 | ... | 0.491629 | 0.844037 | 24.416443 | 1.642722 | 2.198116 | 2.531479 | 0.035992 | 0.916609 | -0.294202 | 0.753914 |
| 3 | 4 | 163.507507 | 667.136392 | 105 | 616 | 224 | 720 | 0 | 3 | 3 | ... | 1.169566 | 0.787356 | 27.764862 | 4.112562 | 2.690033 | 3.187108 | 0.026823 | 1.193745 | -0.348834 | 0.855079 |
| 4 | 5 | 162.581936 | 988.687380 | 112 | 945 | 214 | 1035 | 0 | 5 | 5 | ... | 1.006358 | 0.829287 | 26.639336 | 3.560625 | 2.155954 | 2.585183 | 0.032185 | 1.086397 | -0.390953 | 0.841887 |
| ... | ... | ... | ... | ... | ... | ... | ... | ... | ... | ... | ... | ... | ... | ... | ... | ... | ... | ... | ... | ... | ... |
| 85 | 86 | 1293.937771 | 489.301356 | 1239 | 448 | 1349 | 532 | 7 | 2 | 86 | ... | 1.108200 | 0.742637 | 27.649365 | 3.755580 | 2.774204 | 3.409272 | 0.024679 | 1.263264 | -0.269797 | 0.802120 |
| 86 | 87 | 1284.021505 | 1311.323189 | 1239 | 1275 | 1328 | 1350 | 7 | 7 | 91 | ... | 1.370031 | 0.729467 | 27.969614 | 4.622844 | 2.764216 | 3.452672 | 0.021514 | 1.404993 | -0.260746 | 0.795513 |
| 87 | 88 | 1298.299929 | 1475.423016 | 1250 | 1430 | 1348 | 1523 | 7 | 8 | 92 | ... | 1.242901 | 0.774189 | 27.577465 | 4.450449 | 2.823792 | 3.349485 | 0.026872 | 1.125120 | -0.352028 | 0.868454 |
| 88 | 89 | 1296.660489 | 1624.861193 | 1252 | 1582 | 1335 | 1670 | 7 | 9 | 93 | ... | 1.464127 | 0.724083 | 27.086165 | 5.091357 | 2.989982 | 3.669252 | 0.023581 | 1.321775 | -0.301962 | 0.848755 |
| 89 | 90 | 1305.486899 | 1806.938209 | 1256 | 1762 | 1357 | 1853 | 7 | 10 | 94 | ... | 1.332574 | 0.771103 | 28.552207 | 4.697378 | 2.657524 | 3.214988 | 0.024217 | 1.250490 | -0.333007 | 0.845963 |
90 rows × 233 columns