

Error analysis#
The Error tab in the Results Viewer turns your error-category labels
into a single-measurement cutoff finder. Once you have triaged a
batch of detections into an error category (e.g. background_noise,
debris, merged) on the Colony or QC tab, this tab ranks every
measurement by how cleanly it separates that error category from the
good baseline — then lets you read a suggested cutoff straight off
the distribution and copy a filter spec to apply downstream.
The analysis loop:
Pick an error category chip (each carries a live count).
Read the ranked cutoff table — measurements sorted by how well they discriminate the category, with
AUC, a suggestedcutoff, therecall/specificityat that cutoff, and a Benjamini–Hochberg adjusted p-value.Drag the cutoff line on the good-vs-error distribution (or type a value) to trade recall for specificity, watching the live readout.
Copy the filter spec and apply it in your own post-processing, or
Save analysis reportto write the HTML.Switch the good baseline between
All unlabeledandVerified onlyto control what the error class is being compared against.
Prerequisites#
A finished CLI run whose
deliverables/master_measurements.parquetexists (see Run Locally), so the viewer can bind an output root.At least
min_error_n(8) objects labeled in one error category. The ranked table is the whole point of the tab, and the cutoff finder refuses to rank an underpowered category. Triage detections into a category first — see View Results / QC review walkthrough for the radial-menu curation flow that writes those labels intoqc/curation_labels.parquet. The tutorial dataset is seeded with 12background_noiselabels (the smallest colonies) by the capture script so the populated state below renders.
Walkthrough#
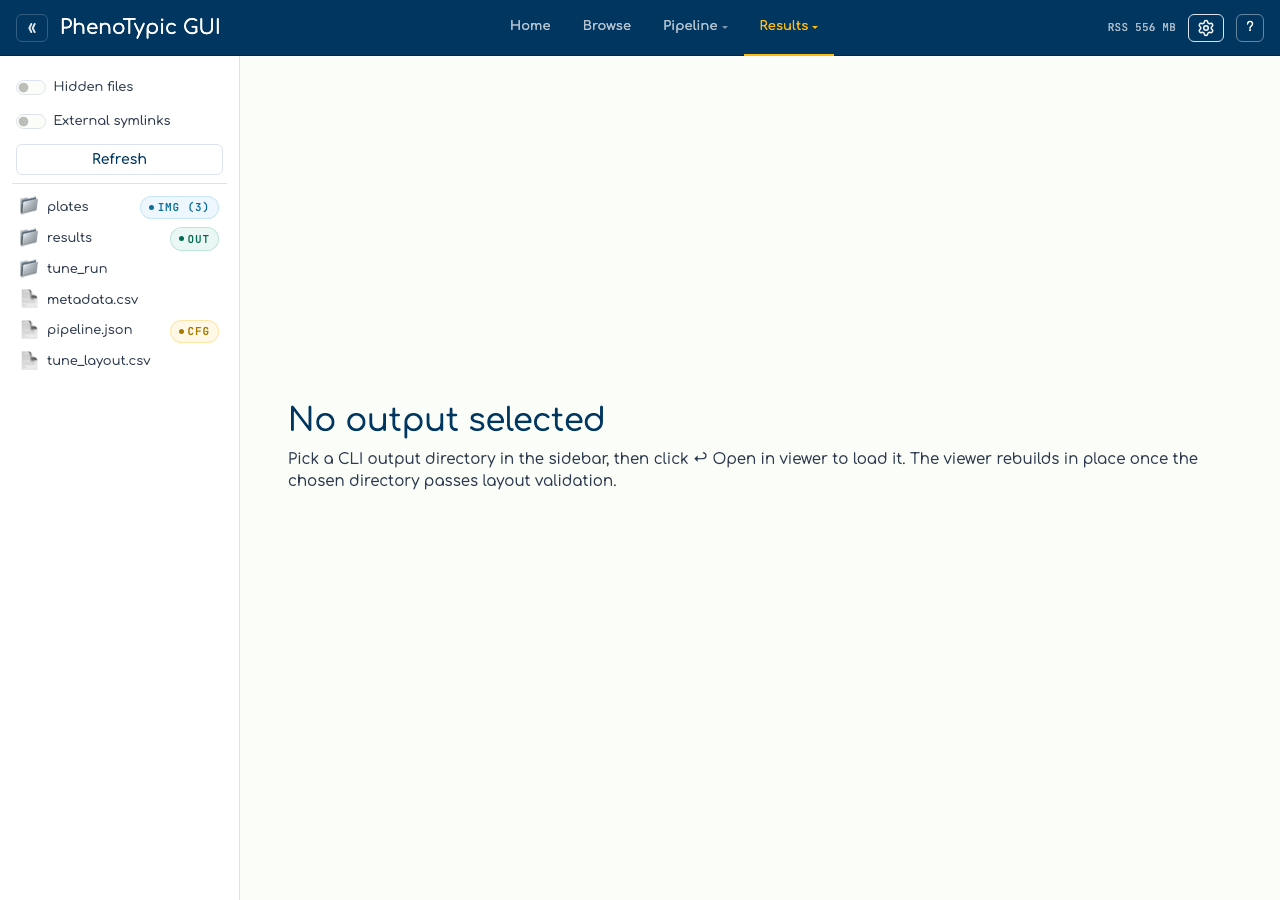
Open the Viewer tab in the hub and pick the Error sub-tab. Before an
output root is bound — or before any error labels exist — the tab shows
its empty state:
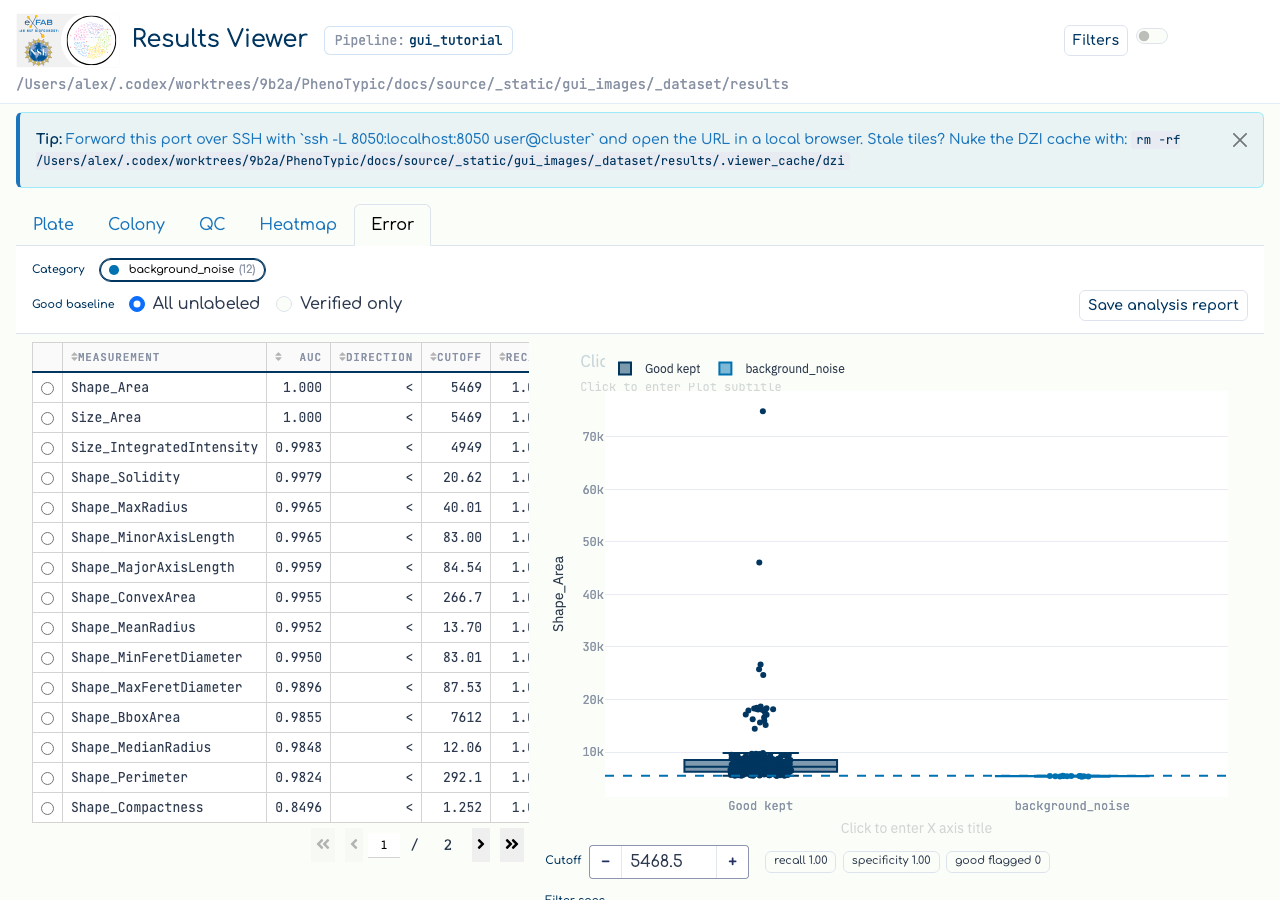
With an output root whose qc/curation_labels.parquet carries enough
labels, the tab populates. The category chip row at the top lists
every labeled category with its count; the selected chip is the focused
category. Below it, the ranked cutoff table lists the measurements
that best separate that category from the good baseline — Shape_Area
and Size_Area rank first here because the seeded background_noise
objects are the smallest colonies. Each row carries the discrimination
AUC, the cutoff DIRECTION (< / >), the suggested CUTOFF, and
the recall / specificity it achieves:
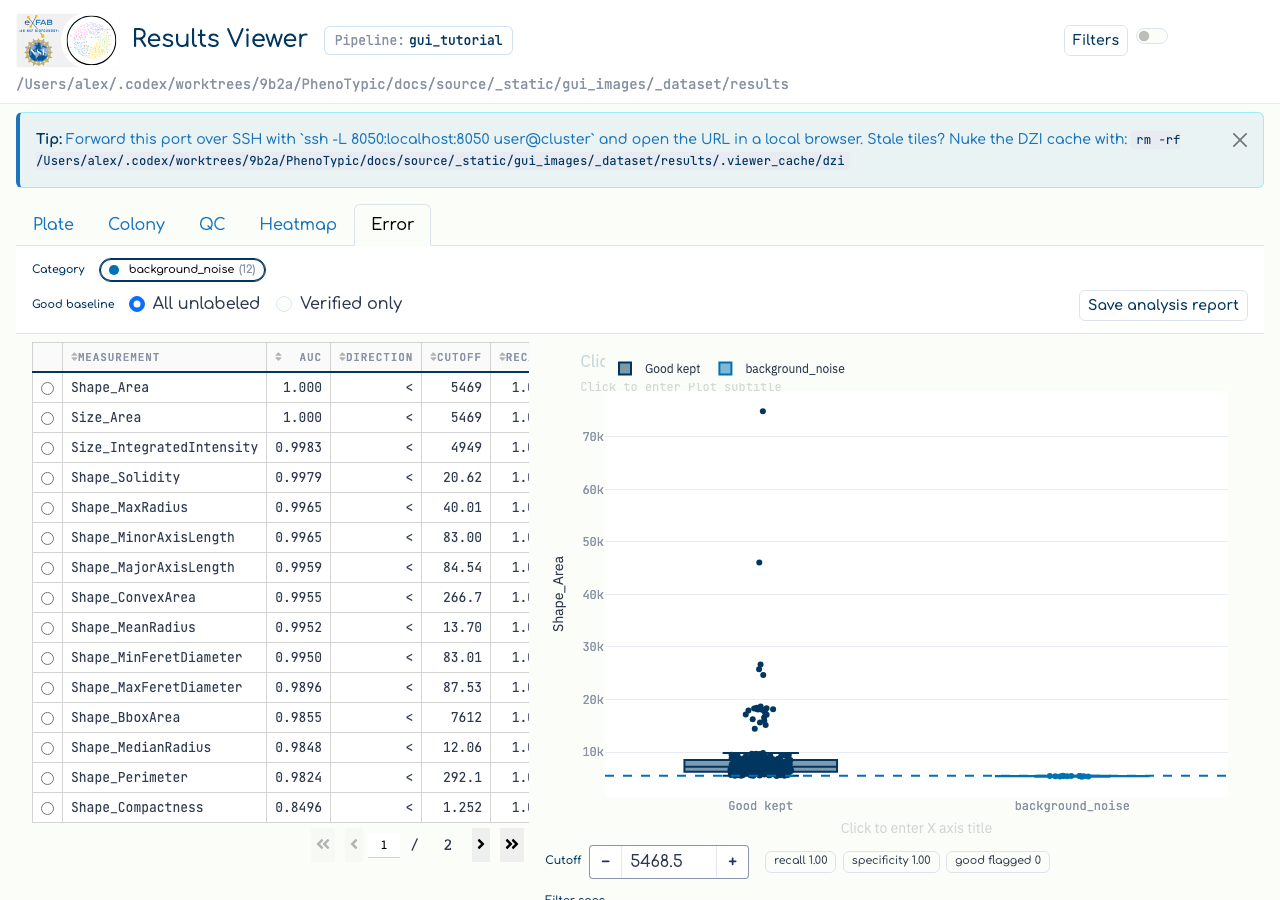
Selecting a measurement focuses it in the good-vs-error distribution
on the right: the good baseline (Good kept) and the error class
(background_noise) are drawn as a box + strip, with the suggested
cutoff as a draggable dashed line. Drag the line (or type into the
Cutoff input) and the recall, specificity, and good flagged
readout updates live so you can trade one against the other. The
read-only filter spec below the figure is copy-able — paste it into your
own post-processing to apply the same threshold:
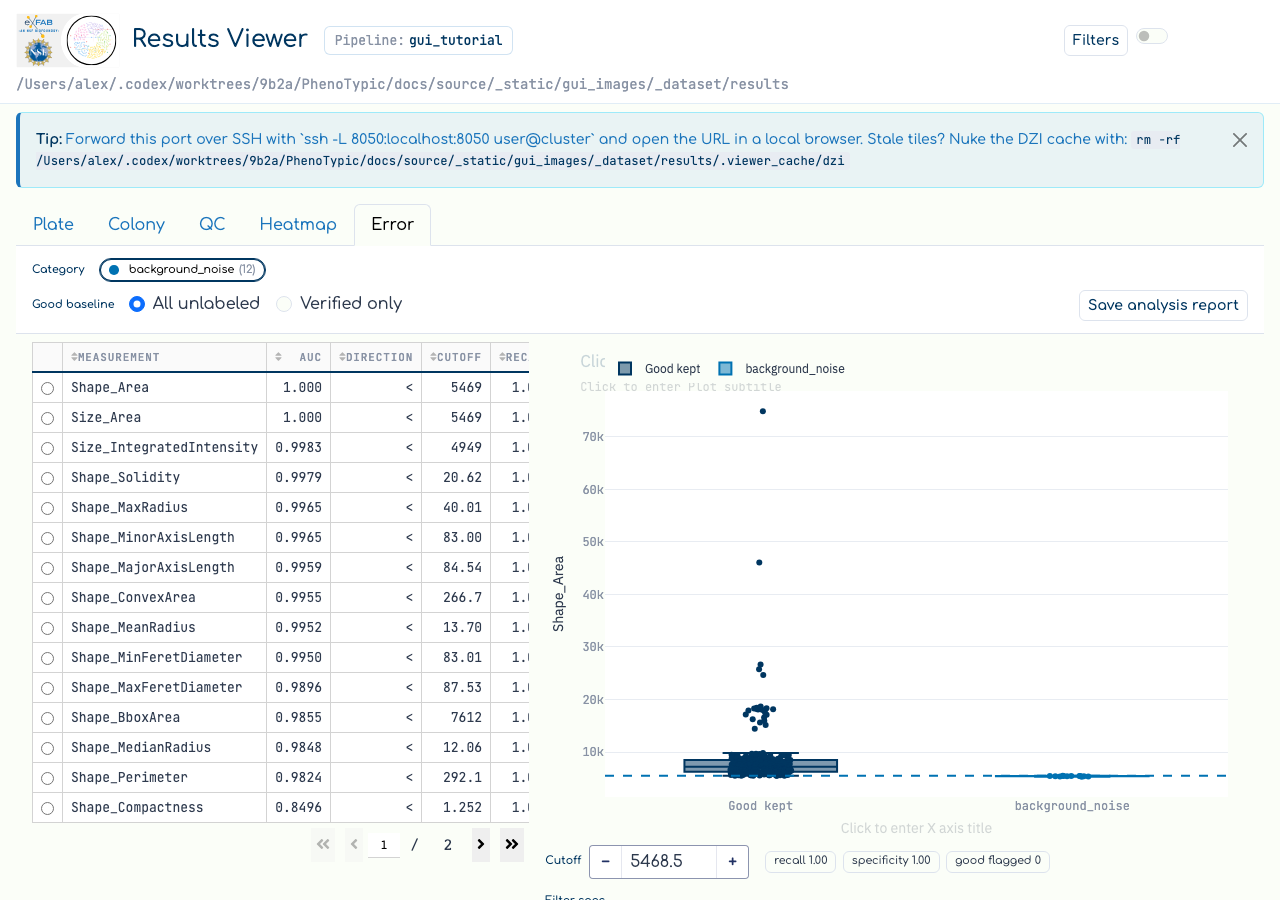
The good baseline toggle controls what the error class is compared against:
All unlabeled(default) — every object you have not labeled is treated as good. This is the right baseline when most detections are fine and you have only triaged the bad ones.Verified only— the good class is restricted to objects in QC-reviewed groups you have explicitly cleared (the verified-good set derived fromqc/review_state.json). Use this when “unlabeled” is not trustworthy — i.e. when you have not yet looked at most objects — so the cutoff is calibrated against a baseline you actually vouched for. The verified-good count badge reports how many objects qualify.
Common gotchas#
“Need more labels.” The empty-state card fires when the focused category has fewer than
min_error_n(8) labeled objects, or when the two classes don’t separate on any measurement. Label more objects in that category (or pick a different category chip) and return to the tab — the recompute runs on tab activation.“Review more QC groups” in verified mode. In
Verified onlymode the good class can fall belowmin_good_n; the empty-state message then points you back to the QC review loop to clear more groups, because the cutoff cannot be calibrated against a too-small verified baseline.The tab recomputes on activation, not on every label. Marking a colony on the Colony or QC tab does not re-run the finder while you are on another tab (it would be wasteful). Returning to the
Errortab always recomputes from the currentqc/curation_labels.parquet.On-disk outputs are dual-owned. The GUI writes
deliverables/error_analysis.{parquet,csv}(focused category) anddeliverables/errors/<category>.parquetlive as you curate; the HTML report is written only onSave analysis report. The next CLI finalize / recompile-mode run re-emitserrors/*anderror_analysis.*(all categories) from the durable labels store, so headless output matches the GUI.deliverables/verified.parquetis GUI-only — the CLI never writes it.Single measurement, single cutoff. This tab finds the best one-measurement threshold per category; multi-measurement rules are out of scope. Combine several copied filter specs by hand if you need a compound rule.
Where to next#
QC review walkthrough — walk worst-first groups for a QC module and clear them, building the verified-good baseline this tab can compare against.
QC curation loop — configure the
QualityCheckanalyzers that surface the colonies worth triaging.View Results — triage detections into error categories with the per-colony radial menu that feeds this tab.