

Run Locally#
The Run console drives a single CLI invocation as a subprocess of the GUI.
Stdout streams into a 5000-line ring buffer and onto disk under
<output_dir>/.gui_log/stdout.log; once the dashboard is written, an iframe
panel shows the live progress dashboard.
Open the run console#
Click the Run tab (or navigate to /run/):
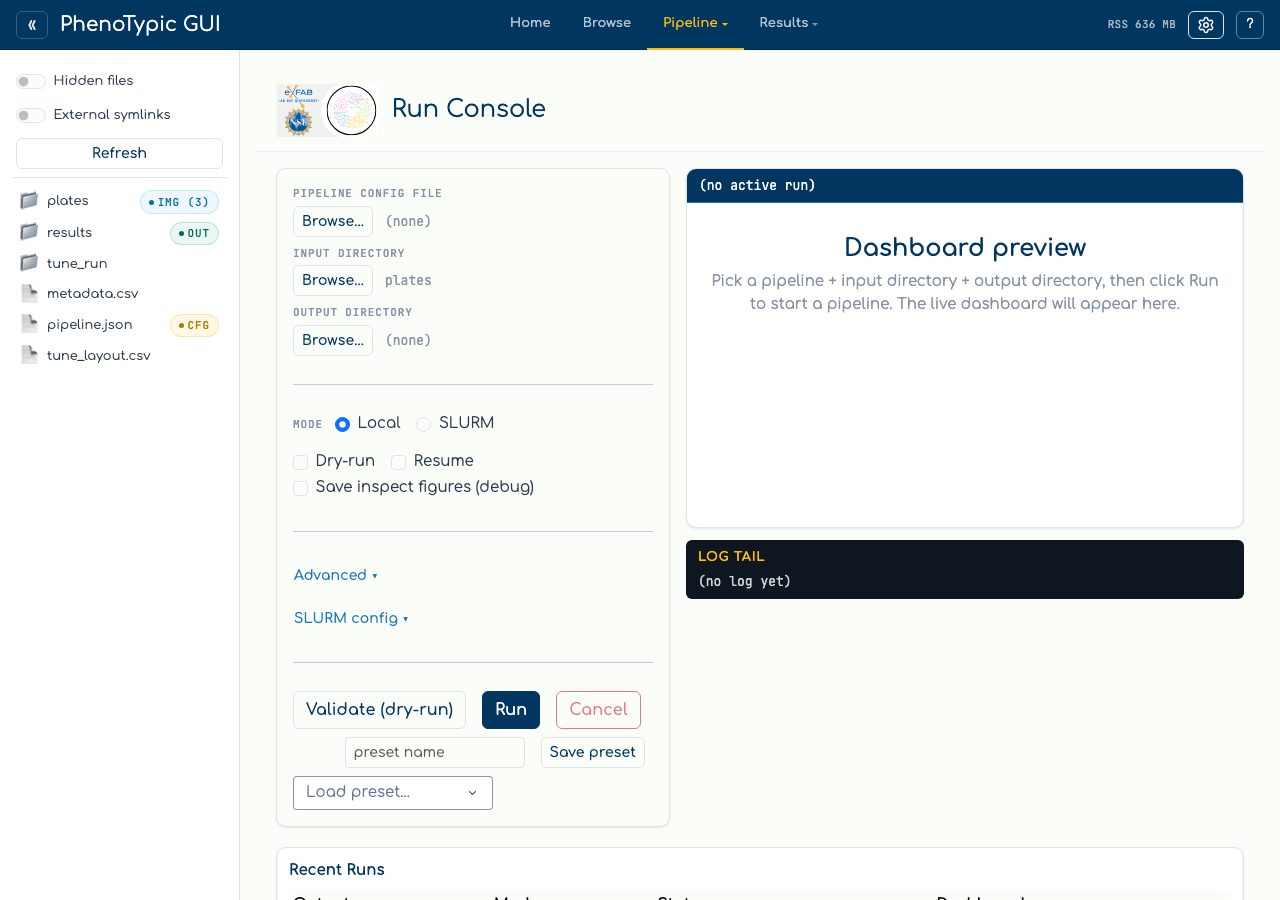
The form has three pickers (Pipeline JSON, Input directory, Output
directory), a Local/SLURM mode radio, two short-flag checkboxes (Dry-run,
Resume), an Advanced collapse for the long-tail flags (--sample,
--nrows, --ncols, --image-type, Workers → --njobs), and a
SLURM config collapse covered on the next page.
The Log level field in Advanced is reserved — the GUI accepts a
value but the CLI does not currently expose --log-level, so the field
is a no-op until that flag lands. The
right pane shows the dashboard preview slot and the log tail.
Pick the pipeline and dataset#
You can fill in the pickers two ways:
From the sidebar (hand-off). Click pipeline.json in the sidebar; the
hand-off banner above the form activates with Set as pipeline. Click it —
the picker label updates. Then click plates/ and use Set as input dir,
and finally choose a fresh output folder and use Set as output dir.
From the inline modal browser. Click any Browse… button. A modal
opens rooted at the sandbox:
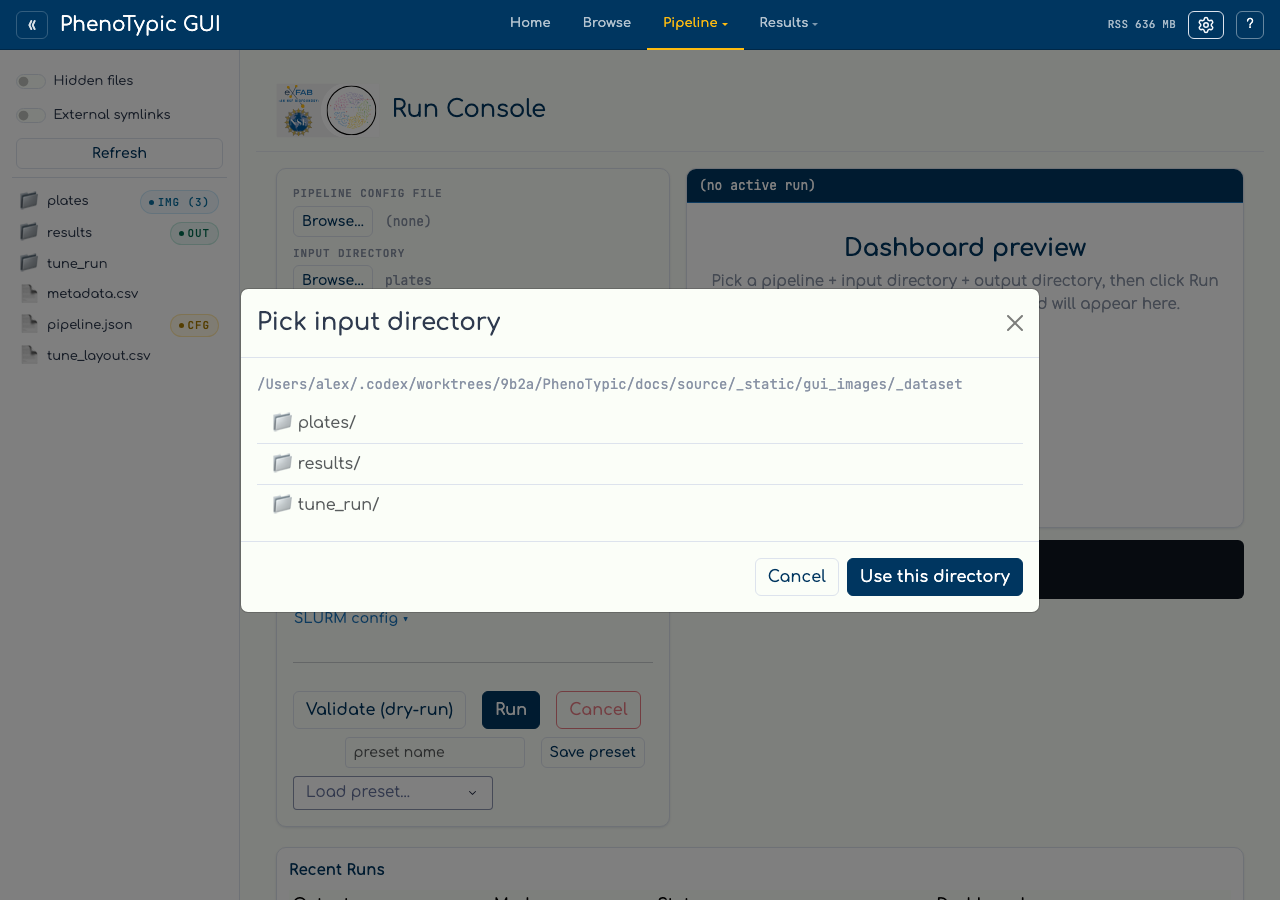
Click into the directory you want and use Use this directory. The modal
respects the same hidden-files / external-symlinks toggles as the sidebar.
Validate before running#
Validate (dry-run) spawns python -m phenotypic --mode full <args> --dry-run. The
CLI parses the pipeline JSON, lists the images it would process, then
exits without writing any output. The log tail shows the dry-run output.
Use this whenever you’re not sure the form values match what the CLI
expects — the dry-run takes seconds, a bad real run can waste minutes.
Run#
Clicking Run spawns python -m phenotypic --mode full <args> (no --dry-run).
While the subprocess is alive:
The log tail polls the ring buffer on a short interval. Lines arrive in order with stderr merged in.
Once the CLI writes
<output_dir>/deliverables/dashboard.html, the iframe panel points at/runs/<rel>/deliverables/dashboard.htmland the live dashboard renders inside the run console — same dashboard you’d open standalone, just iframed.Only one local run can be active at a time; the
Runbutton stays disabled until the current run exits or you clickCancel(which sends SIGTERM, then SIGKILL after a 10-second grace period).
Recent Runs#
The Recent Runs panel below the form lists every run associated with this sandbox — both runs from the current session and historical runs rehydrated from the sandbox at boot time. The screenshot below shows the panel populated with the synthetic dataset’s run:
Each row carries the output directory, mode (local or slurm-<job-id>),
status (rendered uppercase by CSS, stored lowercase as one of running,
complete, failed, cancelled, unknown), and a Dashboard
indicator. Clicking a row re-points the iframe at that run’s dashboard
so you can re-visit historical results without leaving the page.
The status comes from <output_dir>/progress/manifest.json; the dashboard
indicator is true when deliverables/dashboard.html is present. The hub
registers a /runs/<rel>/<file> route on the shell’s Flask server so the
iframe URLs work regardless of which tab is currently active.
For SLURM submissions, see Run on SLURM.