

SHAPE#
Python object: phenotypic.schema._shape.SHAPE
Measure comprehensive morphological characteristics of detected colonies.
Extract geometric metrics from each colony shape: area, perimeter, circularity, convex hull properties, width-based measures, Feret diameters, eccentricity, and best-fit ellipse parameters. The output DataFrame provides a full morphological profile for phenotypic classification and growth-pattern analysis.
Column label |
Description |
Type |
Biology |
Image |
|---|---|---|---|---|
|
Total number of pixels occupied by the microbial colony. Represents colony biomass and growth extent on agar plates. Larger areas typically indicate more robust growth or longer incubation times. |
Projected 2D footprint of the colony in pixels — a common proxy for colony size and overall growth in arrayed plate assays. With matched imaging and incubation, larger area generally reflects greater proliferation or spreading; it captures only the 2D footprint, not colony height or cell density. |
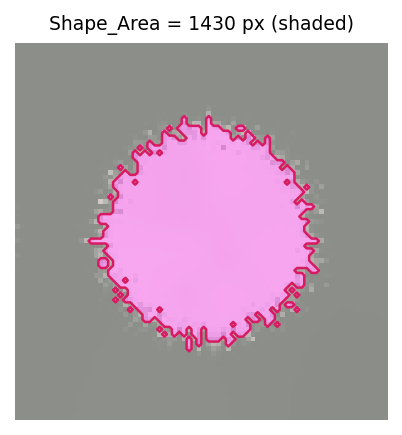
|
|
|
Total length of the colony’s outer boundary in pixels. Measures colony edge complexity and surface irregularity. Smooth, circular colonies have shorter perimeters relative to their area compared to irregular or filamentous colonies. |
|||
|
Calculated as \(\frac{4\pi*\text{Area}}{\text{Perimeter}^2}\). Measures how closely a colony approximates a perfect circle (value = 1). Values < 1 indicate irregular colony morphology, which may result from genetic mutations, environmental stress, or mixed microbial populations on agar plates. |
|||
|
Area of the smallest convex polygon that completely contains the colony. Represents the colony’s “filled-in” appearance if all indentations and holes were removed. Useful for detecting colony spreading patterns or invasive growth characteristics. |
|||
|
Median distance from colony center to edge across all directions. Provides a robust measure of typical colony size that is less sensitive to outliers than mean width. Particularly useful for colonies with uneven growth or sectoring. |
|||
|
Average distance from colony center to edge across all directions. Represents overall colony expansion rate. In arrayed growth assays, this correlates with microbial fitness and growth kinetics under controlled conditions. |
|||
|
Maximum distance from colony center to edge across all directions. Represents the furthest extent of colony growth from its center. In arrayed microbial assays, this measurement helps identify asymmetric growth patterns or colonies extending toward neighboring positions. |
|||
|
Minimum caliper diameter - the shortest distance between two parallel tangent lines touching opposite sides of the colony. Represents the narrowest dimension of the colony regardless of orientation. Useful for detecting elongated or irregular colony morphologies and measuring colony width. |
|||
|
Maximum caliper diameter - the longest distance between two parallel tangent lines touching opposite sides of the colony. Represents the maximum dimension of the colony regardless of orientation. Often exceeds major axis length for irregular shapes and helps quantify maximum colony extent. |
|||
|
Measure of colony elongation, ranging from 0 (perfect circle) to 1 (highly elongated). Values near 0 indicate compact, radially symmetric growth typical of healthy bacterial colonies, while higher values may suggest directional growth, motility, or environmental gradients on the agar surface. |
|||
|
Ratio of actual colony area to its convex hull area (Area/ConvexArea). Values near 1 indicate compact, solid colonies with minimal indentations. Lower values (< 0.9) may indicate invasive growth, colony spreading, or the presence of clearing zones around colonies. |
|||
|
Ratio of colony area to its bounding box area (ObjectArea/BboxArea). Measures how efficiently the colony fills its allocated space. Compact colonies have higher extent values, while spread-out or irregular colonies have lower values. |
|||
|
Area of the smallest rectangle that completely contains the colony. Represents the total spatial shape of the colony including any empty space. In high-throughput assays, this helps assess colony positioning and potential interference with neighboring colonies. |
|||
|
Length of the longest axis of the ellipse that best fits the colony shape. Represents the maximum colony dimension. In arrayed microbial growth, this measurement helps identify colonies that have grown beyond their intended grid positions. |
|||
|
Length of the shortest axis of the ellipse that best fits the colony shape. Represents the minimum colony dimension. Together with major axis length, this helps characterize colony aspect ratio and growth anisotropy. |
|||
|
Calculated as \(\frac{\text{Perimeter}^2}{4\pi*\text{Area}}\). Inverse of circularity (ranges from 1 for perfect circles to higher values for irregular shapes). Measures colony shape complexity - compact, circular colonies have values near 1, while irregular or filamentous colonies have much higher values. |
|||
|
Angle (in radians) between the colony’s major axis and the horizontal axis. Measures colony alignment and growth directionality. Random orientations are typical for most bacterial colonies, while consistent orientations may indicate environmental gradients or mechanical stresses during plating. |