View Results#
The Results viewer pairs the master measurements parquet with each plate’s overlay tiles. You filter the measurements pane on the left, pick an image from the dropdown, and the OpenSeadragon canvas renders the colony map with detection overlays.
Hub viewer (empty state)#
Open the Viewer tab in the hub:
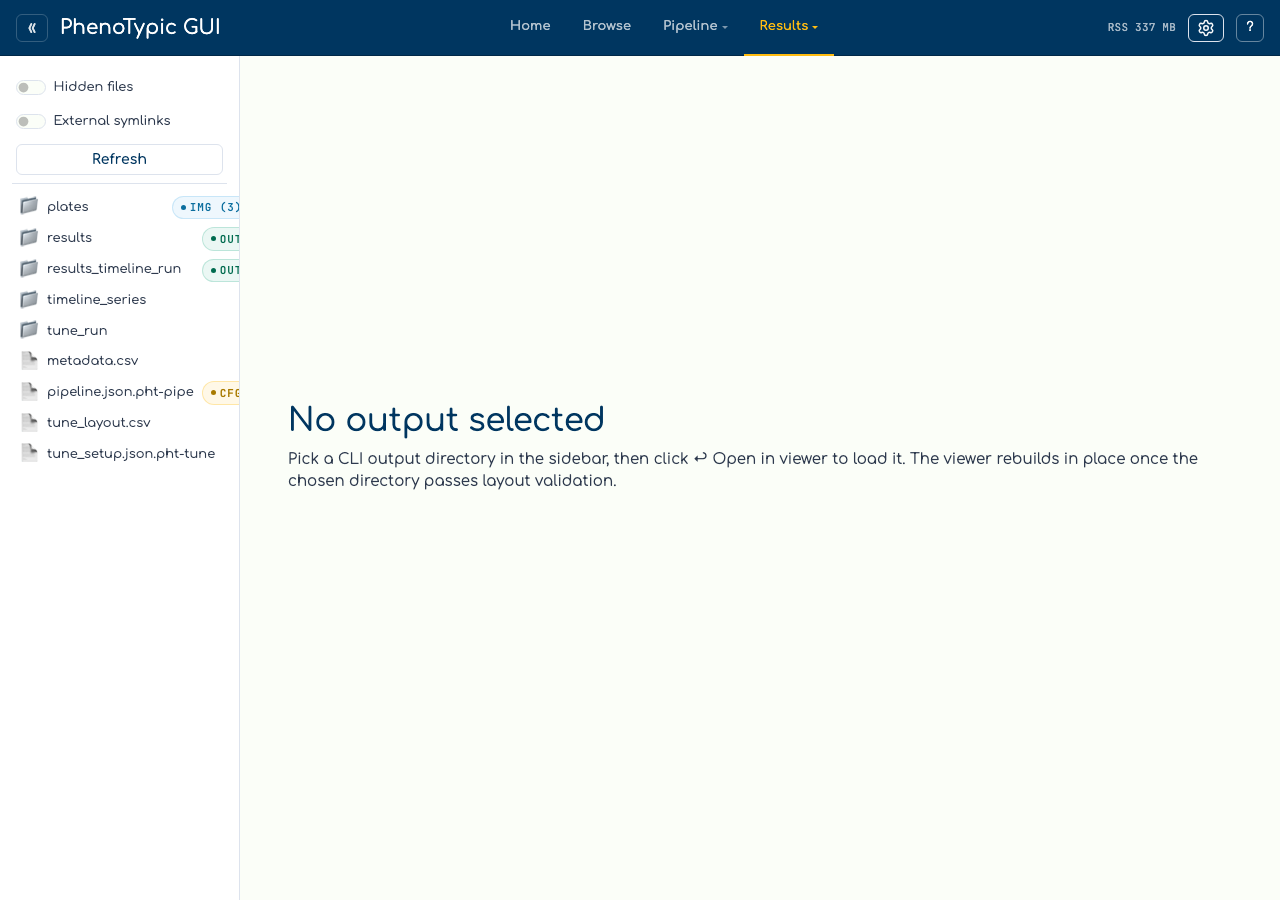
The hub viewer starts in empty state. Pick a CLI output directory in the sidebar and use the hand-off banner to bind it. The shared binding panel reports queued/discovery/publication progress and permits cancellation. Results and Analysis receive one coherent, read-only snapshot, so a failed, cancelled, or superseded bind keeps the previous output visible rather than mixing two runs. If the output-consistency report finds contradictory or incomplete terminal evidence, you may inspect it but mutation controls for QC, Error, curation, Analysis, rebuild, and publication stay disabled. Two other ways to get a populated viewer are:
Standalone launch (recommended for now). Run
phenotypic.gui.results_viewerdirectly with--output-rootpointing at the CLI output:uv run python -m phenotypic.gui.results_viewer \ --output-root gui_tutorial_dataset/results --port 8051
Open
deliverables/dashboard.htmlin a browser. The dashboard is a self-contained HTML report under the output directory’sdeliverables/subfolder; you don’t need a server to view it.
The remaining screenshots come from the standalone launcher pointed at the output the Run Locally page produced.
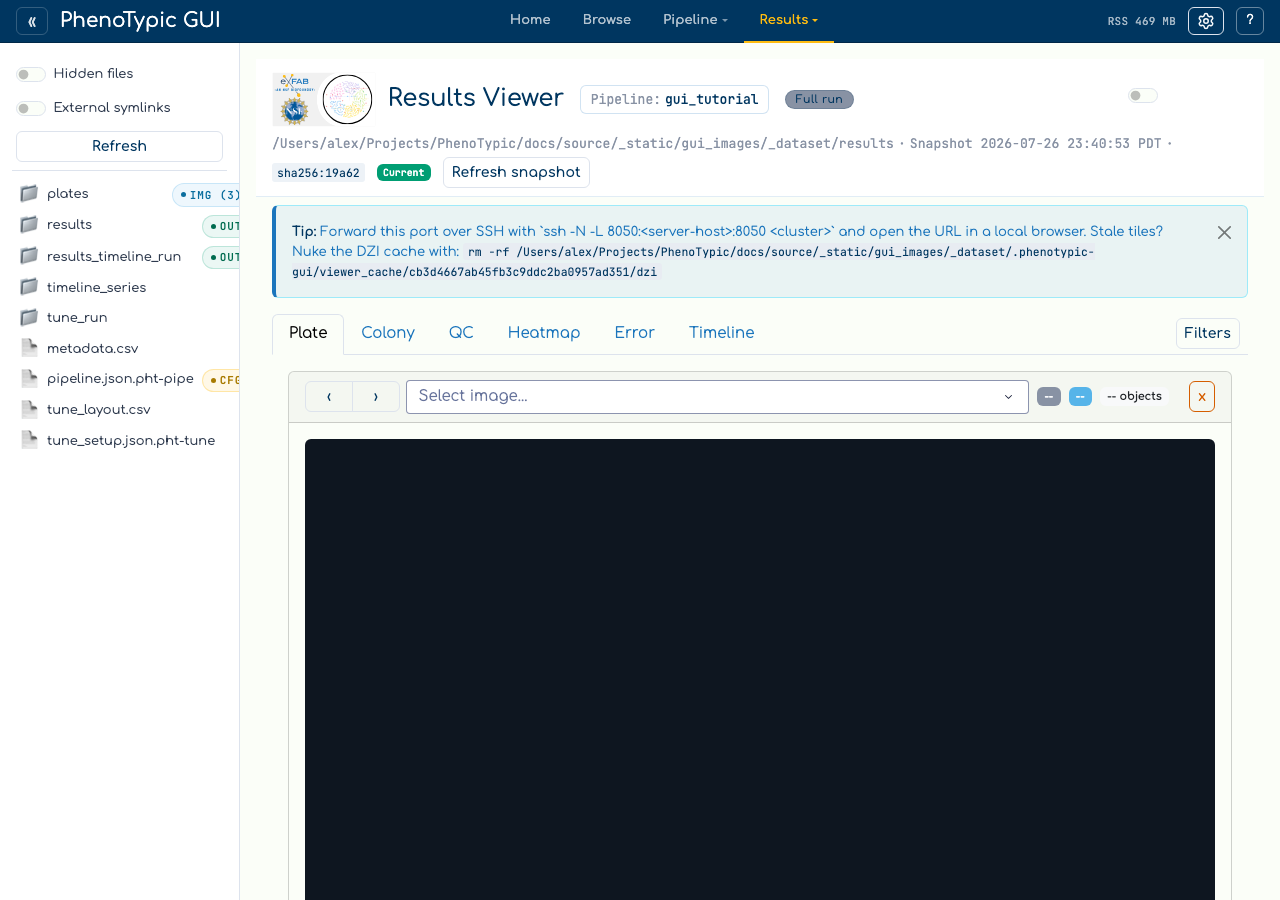
Loaded viewer#
Note
The screenshots below are the standalone results viewer (no top bar / sidebar) so the page header reads “Results Viewer” instead of “PhenoTypic GUI”. The body is identical to a bound hub snapshot.
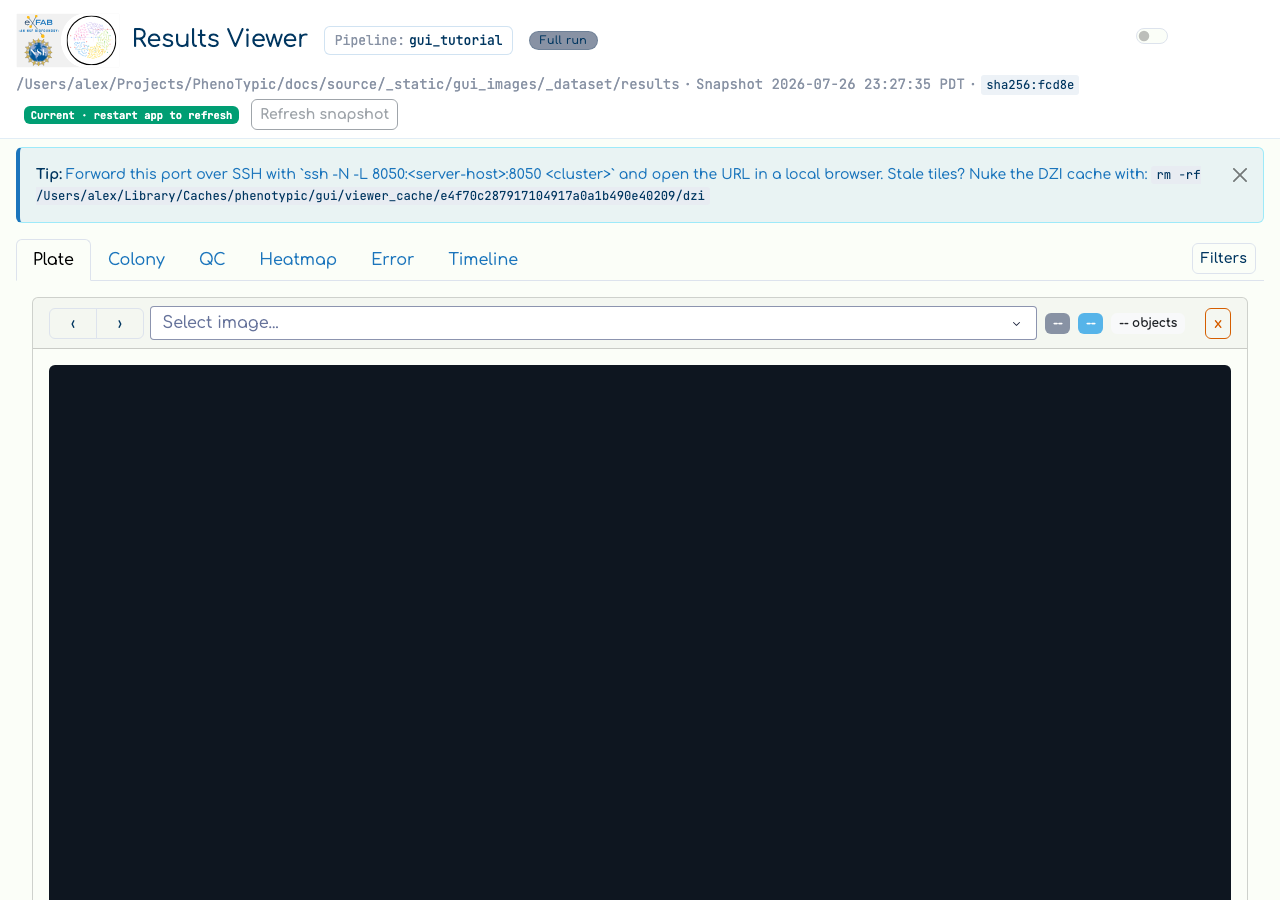
The viewer is split into three regions:
Region |
Contents |
|---|---|
Header |
The output’s pipeline name (here |
Filter pane (left) |
A query builder over |
Plate / Colony tabs (right) |
|
To render a plate, pick a filename from the Select image… dropdown. The
dropdown is populated from the master measurements; once you pick one,
the OpenSeadragon canvas tiles the overlay and the > Details link
reveals per-image stats. Clicking individual colonies in the canvas
highlights the matching row in the measurements.
Scrolling further shows the full measurements table.
Memory note#
The viewer loads the master measurements parquet and per-image overlays
into memory on first access. If the parquet is large (tens of MB+),
expect the first navigation to take a moment. Subsequent navigation
between plates reuses the in-memory state. When the viewer is mounted
inside the hub, the hub chrome’s Release control (not visible in the
standalone screenshots above) drops the in-memory state; the next
access reloads from disk. Standalone viewers intentionally do not subscribe to
hub refresh events.
Process RSS may not return to the OS after release — the CPython allocator pools freed pages rather than returning them immediately. “Release” is honest about freeing the Python object graph; it is not a promise about RSS.
Where to next#
GUI hub guide — the full reference for every panel, store, and admonition in the hub.
SLURM Pipelines — chunk sizing, resume semantics, recompile flags.
CLI Batch Processing — every CLI flag the Run console form exposes (and a few more).
CLI Execution Modes — what
full,measure,recompile, andprocesseach produce.